Precipitation-Runoff and Streamflow-Routing Models for the ...
Precipitation-Runoff and Streamflow-Routing Models for the ...
Precipitation-Runoff and Streamflow-Routing Models for the ...
- No tags were found...

You also want an ePaper? Increase the reach of your titles
YUMPU automatically turns print PDFs into web optimized ePapers that Google loves.
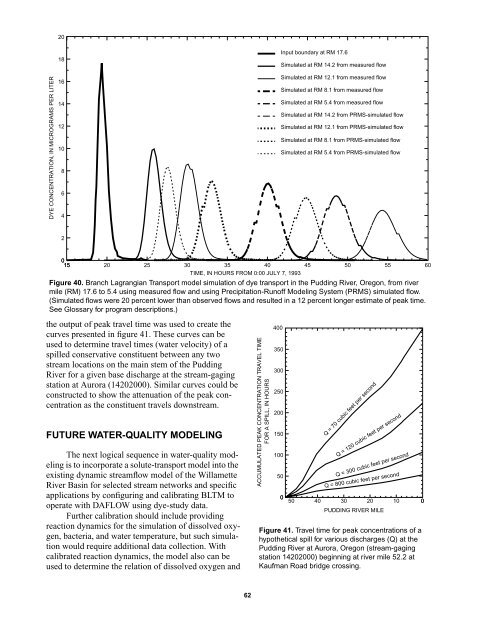
20DYE CONCENTRATION, IN MICROGRAMS PER LITER1816141210864Input boundary at RM 17.6Simulated at RM 14.2 from measured flowSimulated at RM 12.1 from measured flowSimulated at RM 8.1 from measured flowSimulated at RM 5.4 from measured flowSimulated at RM 14.2 from PRMS-simulated flowSimulated at RM 12.1 from PRMS-simulated flowSimulated at RM 8.1 from PRMS-simulated flowSimulated at RM 5.4 from PRMS-simulated flow2015 20 25 30 35 40 45 50 5560TIME, IN HOURS FROM 0:00 JULY 7, 1993Figure 40. Branch Lagrangian Transport model simulation of dye transport in <strong>the</strong> Pudding River, Oregon, from rivermile (RM) 17.6 to 5.4 using measured flow <strong>and</strong> using <strong>Precipitation</strong>-<strong>Runoff</strong> Modeling System (PRMS) simulated flow.(Simulated flows were 20 percent lower than observed flows <strong>and</strong> resulted in a 12 percent longer estimate of peak time.See Glossary <strong>for</strong> program descriptions.)<strong>the</strong> output of peak travel time was used to create <strong>the</strong>curves presented in figure 41. These curves can beused to determine travel times (water velocity) of aspilled conservative constituent between any twostream locations on <strong>the</strong> main stem of <strong>the</strong> PuddingRiver <strong>for</strong> a given base discharge at <strong>the</strong> stream-gagingstation at Aurora (14202000). Similar curves could beconstructed to show <strong>the</strong> attenuation of <strong>the</strong> peak concentrationas <strong>the</strong> constituent travels downstream.FUTURE WATER-QUALITY MODELINGThe next logical sequence in water-quality modelingis to incorporate a solute-transport model into <strong>the</strong>existing dynamic streamflow model of <strong>the</strong> WillametteRiver Basin <strong>for</strong> selected stream networks <strong>and</strong> specificapplications by configuring <strong>and</strong> calibrating BLTM tooperate with DAFLOW using dye-study data.Fur<strong>the</strong>r calibration should include providingreaction dynamics <strong>for</strong> <strong>the</strong> simulation of dissolved oxygen,bacteria, <strong>and</strong> water temperature, but such simulationwould require additional data collection. Withcalibrated reaction dynamics, <strong>the</strong> model also can beused to determine <strong>the</strong> relation of dissolved oxygen <strong>and</strong>ACCUMULATED PEAK CONCENTRATION TRAVEL TIMEFOR A SPILL, IN HOURS4003503002502001501005005040Q = 70 cubic feet per secondQ = 120 cubic feet per secondQ = 300 cubic feet per secondQ = 800 cubic feet per second3020PUDDING RIVER MILEFigure 41. Travel time <strong>for</strong> peak concentrations of ahypo<strong>the</strong>tical spill <strong>for</strong> various discharges (Q) at <strong>the</strong>Pudding River at Aurora, Oregon (stream-gagingstation 14202000) beginning at river mile 52.2 atKaufman Road bridge crossing.10062