Precipitation-Runoff and Streamflow-Routing Models for the ...
Precipitation-Runoff and Streamflow-Routing Models for the ...
Precipitation-Runoff and Streamflow-Routing Models for the ...
- No tags were found...

Create successful ePaper yourself
Turn your PDF publications into a flip-book with our unique Google optimized e-Paper software.
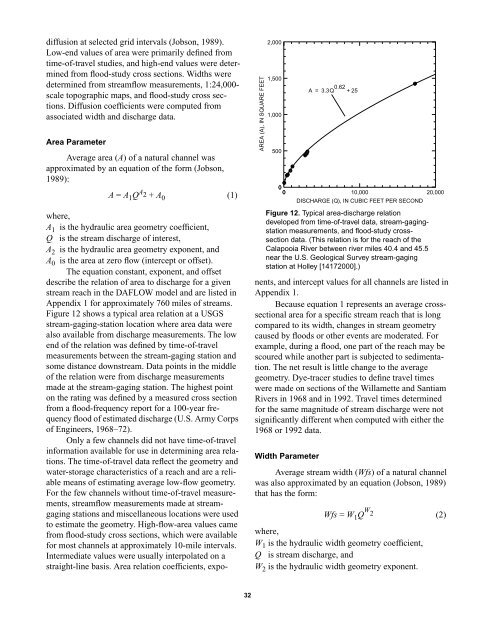
diffusion at selected grid intervals (Jobson, 1989).Low-end values of area were primarily defined fromtime-of-travel studies, <strong>and</strong> high-end values were determinedfrom flood-study cross sections. Widths weredetermined from streamflow measurements, 1:24,000-scale topographic maps, <strong>and</strong> flood-study cross sections.Diffusion coefficients were computed fromassociated width <strong>and</strong> discharge data.Area ParameterAverage area (A) of a natural channel wasapproximated by an equation of <strong>the</strong> <strong>for</strong>m (Jobson,1989):A = A 1 Q A 2 + A 0 (1)AREA (A), IN SQUARE FEET2,0001,5001,00050000 10,00020,000where,A 1 is <strong>the</strong> hydraulic area geometry coefficient,Q is <strong>the</strong> stream discharge of interest,A 2 is <strong>the</strong> hydraulic area geometry exponent, <strong>and</strong>A 0 is <strong>the</strong> area at zero flow (intercept or offset).The equation constant, exponent, <strong>and</strong> offsetdescribe <strong>the</strong> relation of area to discharge <strong>for</strong> a givenstream reach in <strong>the</strong> DAFLOW model <strong>and</strong> are listed inAppendix 1 <strong>for</strong> approximately 760 miles of streams.Figure 12 shows a typical area relation at a USGSstream-gaging-station location where area data werealso available from discharge measurements. The lowend of <strong>the</strong> relation was defined by time-of-travelmeasurements between <strong>the</strong> stream-gaging station <strong>and</strong>some distance downstream. Data points in <strong>the</strong> middleof <strong>the</strong> relation were from discharge measurementsmade at <strong>the</strong> stream-gaging station. The highest pointon <strong>the</strong> rating was defined by a measured cross sectionfrom a flood-frequency report <strong>for</strong> a 100-year frequencyflood of estimated discharge (U.S. Army Corpsof Engineers, 1968–72).Only a few channels did not have time-of-travelin<strong>for</strong>mation available <strong>for</strong> use in determining area relations.The time-of-travel data reflect <strong>the</strong> geometry <strong>and</strong>water-storage characteristics of a reach <strong>and</strong> are a reliablemeans of estimating average low-flow geometry.For <strong>the</strong> few channels without time-of-travel measurements,streamflow measurements made at streamgagingstations <strong>and</strong> miscellaneous locations were usedto estimate <strong>the</strong> geometry. High-flow-area values camefrom flood-study cross sections, which were available<strong>for</strong> most channels at approximately 10-mile intervals.Intermediate values were usually interpolated on astraight-line basis. Area relation coefficients, exponents,<strong>and</strong> intercept values <strong>for</strong> all channels are listed inAppendix 1.Because equation 1 represents an average crosssectionalarea <strong>for</strong> a specific stream reach that is longcompared to its width, changes in stream geometrycaused by floods or o<strong>the</strong>r events are moderated. Forexample, during a flood, one part of <strong>the</strong> reach may bescoured while ano<strong>the</strong>r part is subjected to sedimentation.The net result is little change to <strong>the</strong> averagegeometry. Dye-tracer studies to define travel timeswere made on sections of <strong>the</strong> Willamette <strong>and</strong> SantiamRivers in 1968 <strong>and</strong> in 1992. Travel times determined<strong>for</strong> <strong>the</strong> same magnitude of stream discharge were notsignificantly different when computed with ei<strong>the</strong>r <strong>the</strong>1968 or 1992 data.Width ParameterA = 3.3Q 0.62 + 25DISCHARGE (Q), IN CUBIC FEET PER SECONDFigure 12. Typical area-discharge relationdeveloped from time-of-travel data, stream-gagingstationmeasurements, <strong>and</strong> flood-study crosssectiondata. (This relation is <strong>for</strong> <strong>the</strong> reach of <strong>the</strong>Calapooia River between river miles 40.4 <strong>and</strong> 45.5near <strong>the</strong> U.S. Geological Survey stream-gagingstation at Holley [14172000].)Average stream width (Wfs) of a natural channelwas also approximated by an equation (Jobson, 1989)that has <strong>the</strong> <strong>for</strong>m:Wfs = W 1 Q W 2 (2)where,W 1 is <strong>the</strong> hydraulic width geometry coefficient,Q is stream discharge, <strong>and</strong>W 2 is <strong>the</strong> hydraulic width geometry exponent.32