Precipitation-Runoff and Streamflow-Routing Models for the ...
Precipitation-Runoff and Streamflow-Routing Models for the ...
Precipitation-Runoff and Streamflow-Routing Models for the ...
- No tags were found...

Create successful ePaper yourself
Turn your PDF publications into a flip-book with our unique Google optimized e-Paper software.
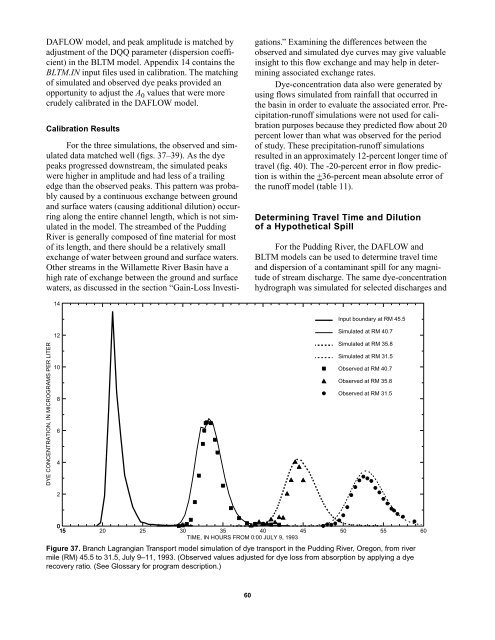
DAFLOW model, <strong>and</strong> peak amplitude is matched byadjustment of <strong>the</strong> DQQ parameter (dispersion coefficient)in <strong>the</strong> BLTM model. Appendix 14 contains <strong>the</strong>BLTM.IN input files used in calibration. The matchingof simulated <strong>and</strong> observed dye peaks provided anopportunity to adjust <strong>the</strong> A 0 values that were morecrudely calibrated in <strong>the</strong> DAFLOW model.Calibration ResultsFor <strong>the</strong> three simulations, <strong>the</strong> observed <strong>and</strong> simulateddata matched well (figs. 37–39). As <strong>the</strong> dyepeaks progressed downstream, <strong>the</strong> simulated peakswere higher in amplitude <strong>and</strong> had less of a trailingedge than <strong>the</strong> observed peaks. This pattern was probablycaused by a continuous exchange between ground<strong>and</strong> surface waters (causing additional dilution) occurringalong <strong>the</strong> entire channel length, which is not simulatedin <strong>the</strong> model. The streambed of <strong>the</strong> PuddingRiver is generally composed of fine material <strong>for</strong> mostof its length, <strong>and</strong> <strong>the</strong>re should be a relatively smallexchange of water between ground <strong>and</strong> surface waters.O<strong>the</strong>r streams in <strong>the</strong> Willamette River Basin have ahigh rate of exchange between <strong>the</strong> ground <strong>and</strong> surfacewaters, as discussed in <strong>the</strong> section “Gain-Loss Investigations.”Examining <strong>the</strong> differences between <strong>the</strong>observed <strong>and</strong> simulated dye curves may give valuableinsight to this flow exchange <strong>and</strong> may help in determiningassociated exchange rates.Dye-concentration data also were generated byusing flows simulated from rainfall that occurred in<strong>the</strong> basin in order to evaluate <strong>the</strong> associated error. <strong>Precipitation</strong>-runoffsimulations were not used <strong>for</strong> calibrationpurposes because <strong>the</strong>y predicted flow about 20percent lower than what was observed <strong>for</strong> <strong>the</strong> periodof study. These precipitation-runoff simulationsresulted in an approximately 12-percent longer time oftravel (fig. 40). The -20-percent error in flow predictionis within <strong>the</strong> +36-percent mean absolute error of<strong>the</strong> runoff model (table 11).Determining Travel Time <strong>and</strong> Dilutionof a Hypo<strong>the</strong>tical SpillFor <strong>the</strong> Pudding River, <strong>the</strong> DAFLOW <strong>and</strong>BLTM models can be used to determine travel time<strong>and</strong> dispersion of a contaminant spill <strong>for</strong> any magnitudeof stream discharge. The same dye-concentrationhydrograph was simulated <strong>for</strong> selected discharges <strong>and</strong>14Input boundary at RM 45.5DYE CONCENTRATION, IN MICROGRAMS PER LITER1210864Simulated at RM 40.7Simulated at RM 35.8Simulated at RM 31.5Observed at RM 40.7Observed at RM 35.8Observed at RM 31.52015 20 25 30 35 40 45 50 5560TIME, IN HOURS FROM 0:00 JULY 9, 1993Figure 37. Branch Lagrangian Transport model simulation of dye transport in <strong>the</strong> Pudding River, Oregon, from rivermile (RM) 45.5 to 31.5, July 9–11, 1993. (Observed values adjusted <strong>for</strong> dye loss from absorption by applying a dyerecovery ratio. (See Glossary <strong>for</strong> program description.)60