Precipitation-Runoff and Streamflow-Routing Models for the ...
Precipitation-Runoff and Streamflow-Routing Models for the ...
Precipitation-Runoff and Streamflow-Routing Models for the ...
- No tags were found...

You also want an ePaper? Increase the reach of your titles
YUMPU automatically turns print PDFs into web optimized ePapers that Google loves.
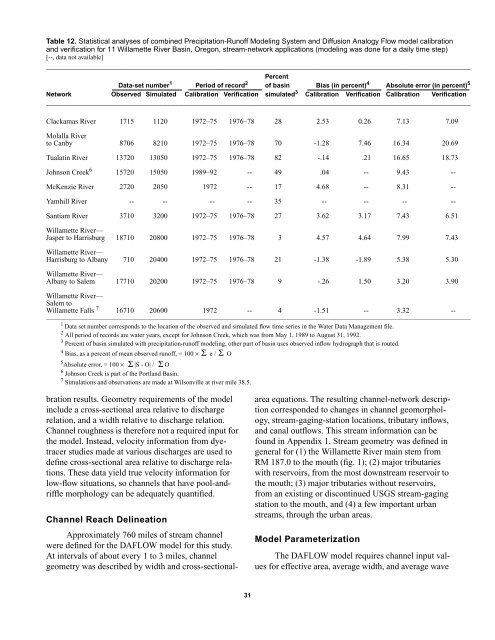
Table 12. Statistical analyses of combined <strong>Precipitation</strong>-<strong>Runoff</strong> Modeling System <strong>and</strong> Diffusion Analogy Flow model calibration<strong>and</strong> verification <strong>for</strong> 11 Willamette River Basin, Oregon, stream-network applications (modeling was done <strong>for</strong> a daily time step)[--, data not available]_________________________________________________________________________________________________________PercentData-set number 1 Period of record 2 of basin Bias (in percent) 4 Absolute error (in percent) 5Network Observed Simulated Calibration Verification simulated 3 Calibration Verification Calibration Verification_________________________________________________________________________________________________________Clackamas River 1715 1120 1972–75 1976–78 28 2.53 0.26 7.13 7.09Molalla Riverto Canby 8706 8210 1972–75 1976–78 70 -1.28 7.46 16.34 20.69Tualatin River 13720 13050 1972–75 1976–78 82 -.14 .21 16.65 18.73Johnson Creek 6 15720 15050 1989–92 -- 49 .04 .-- 9.43 .--McKenzie River 2720 2050 1972 -- 17 4.68 .-- 8.31 .--Yamhill River -- -- -- -- 35 .-- .-- .-- .--Santiam River 3710 3200 1972–75 1976–78 27 3.62 3.17 7.43 6.51Willamette River—Jasper to Harrisburg 18710 20800 1972–75 1976–78 3 4.57 4.64 7.99 7.43Willamette River—Harrisburg to Albany 710 20400 1972–75 1976–78 21 -1.38 -1.89 5.38 5.30Willamette River—Albany to Salem 17710 20200 1972–75 1976–78 9 -.26 1.50 3.20 3.90Willamette River—Salem toWillamette Falls 7 16710 20600 1972 -- 4 -1.51 .-- 3.32 .--______________________________________________________________________________________________________________________________________________________1 Data set number corresponds to <strong>the</strong> location of <strong>the</strong> observed <strong>and</strong> simulated flow time series in <strong>the</strong> Water Data Management file.2 All period of records are water years, except <strong>for</strong> Johnson Creek, which was from May 1, 1989 to August 31, 1992.3 Percent of basin simulated with precipitation-runoff modeling, o<strong>the</strong>r part of basin uses observed inflow hydrograph that is routed.4 Bias, as a percent of mean observed runoff, = 100 × Σ e / Σ O5 Absolute error, = 100 × |S - O| / OΣ6 Johnson Creek is part of <strong>the</strong> Portl<strong>and</strong> Basin.7 Simulations <strong>and</strong> observations are made at Wilsonville at river mile 38.5.Σbration results. Geometry requirements of <strong>the</strong> modelinclude a cross-sectional area relative to dischargerelation, <strong>and</strong> a width relative to discharge relation.Channel roughness is <strong>the</strong>re<strong>for</strong>e not a required input <strong>for</strong><strong>the</strong> model. Instead, velocity in<strong>for</strong>mation from dyetracerstudies made at various discharges are used todefine cross-sectional area relative to discharge relations.These data yield true velocity in<strong>for</strong>mation <strong>for</strong>low-flow situations, so channels that have pool-<strong>and</strong>rifflemorphology can be adequately quantified.Channel Reach DelineationApproximately 760 miles of stream channelwere defined <strong>for</strong> <strong>the</strong> DAFLOW model <strong>for</strong> this study.At intervals of about every 1 to 3 miles, channelgeometry was described by width <strong>and</strong> cross-sectionalareaequations. The resulting channel-network descriptioncorresponded to changes in channel geomorphology,stream-gaging-station locations, tributary inflows,<strong>and</strong> canal outflows. This stream in<strong>for</strong>mation can befound in Appendix 1. Stream geometry was defined ingeneral <strong>for</strong> (1) <strong>the</strong> Willamette River main stem fromRM 187.0 to <strong>the</strong> mouth (fig. 1); (2) major tributarieswith reservoirs, from <strong>the</strong> most downstream reservoir to<strong>the</strong> mouth; (3) major tributaries without reservoirs,from an existing or discontinued USGS stream-gagingstation to <strong>the</strong> mouth, <strong>and</strong> (4) a few important urbanstreams, through <strong>the</strong> urban areas.Model ParameterizationThe DAFLOW model requires channel input values<strong>for</strong> effective area, average width, <strong>and</strong> average wave31