Precipitation-Runoff and Streamflow-Routing Models for the ...
Precipitation-Runoff and Streamflow-Routing Models for the ...
Precipitation-Runoff and Streamflow-Routing Models for the ...
- No tags were found...

Create successful ePaper yourself
Turn your PDF publications into a flip-book with our unique Google optimized e-Paper software.
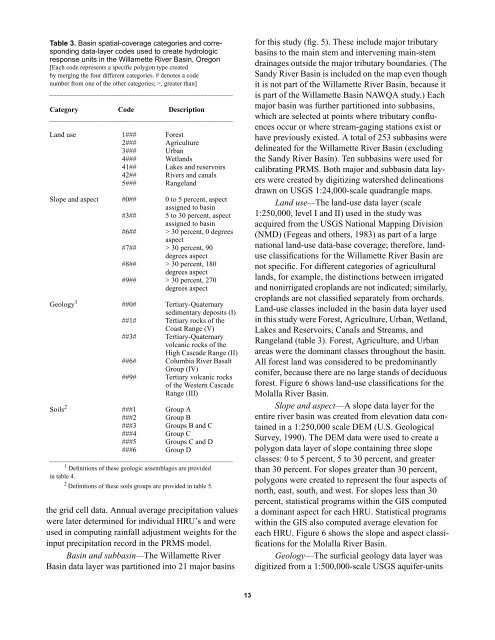
Table 3. Basin spatial-coverage categories <strong>and</strong> correspondingdata-layer codes used to create hydrologicresponse units in <strong>the</strong> Willamette River Basin, Oregon[Each code represents a specific polygon type createdby merging <strong>the</strong> four different categories. # denotes a codenumber from one of <strong>the</strong> o<strong>the</strong>r categories; >, greater than]___________________________________________________Category Code Description___________________________________________________L<strong>and</strong> use 1### Forest2### Agriculture3### Urban4### Wetl<strong>and</strong>s41## Lakes <strong>and</strong> reservoirs42## Rivers <strong>and</strong> canals5### Rangel<strong>and</strong>Slope <strong>and</strong> aspect #0## 0 to 5 percent, aspectassigned to basin#3## 5 to 30 percent, aspectassigned to basin#6## > 30 percent, 0 degreesaspect#7## > 30 percent, 90degrees aspect#8## > 30 percent, 180degrees aspect#9## > 30 percent, 270degrees aspectGeology 1 ##0# Tertiary-Quaternarysedimentary deposits (I)##1# Tertiary rocks of <strong>the</strong>Coast Range (V)##3# Tertiary-Quaternaryvolcanic rocks of <strong>the</strong>High Cascade Range (II)##6# Columbia River BasaltGroup (IV)##9# Tertiary volcanic rocksof <strong>the</strong> Western CascadeRange (III)Soils 2 ###1 Group A###2 Group B###3 Groups B <strong>and</strong> C###4 Group C###5 Groups C <strong>and</strong> D###6 Group D___________________________________________________1 Definitions of <strong>the</strong>se geologic assemblages are providedin table 4.2 Definitions of <strong>the</strong>se soils groups are provided in table 5.<strong>the</strong> grid cell data. Annual average precipitation valueswere later determined <strong>for</strong> individual HRU’s <strong>and</strong> wereused in computing rainfall adjustment weights <strong>for</strong> <strong>the</strong>input precipitation record in <strong>the</strong> PRMS model.Basin <strong>and</strong> subbasin—The Willamette RiverBasin data layer was partitioned into 21 major basins<strong>for</strong> this study (fig. 5). These include major tributarybasins to <strong>the</strong> main stem <strong>and</strong> intervening main-stemdrainages outside <strong>the</strong> major tributary boundaries. (TheS<strong>and</strong>y River Basin is included on <strong>the</strong> map even thoughit is not part of <strong>the</strong> Willamette River Basin, because itis part of <strong>the</strong> Willamette Basin NAWQA study.) Eachmajor basin was fur<strong>the</strong>r partitioned into subbasins,which are selected at points where tributary confluencesoccur or where stream-gaging stations exist orhave previously existed. A total of 253 subbasins weredelineated <strong>for</strong> <strong>the</strong> Willamette River Basin (excluding<strong>the</strong> S<strong>and</strong>y River Basin). Ten subbasins were used <strong>for</strong>calibrating PRMS. Both major <strong>and</strong> subbasin data layerswere created by digitizing watershed delineationsdrawn on USGS 1:24,000-scale quadrangle maps.L<strong>and</strong> use—The l<strong>and</strong>-use data layer (scale1:250,000, level I <strong>and</strong> II) used in <strong>the</strong> study wasacquired from <strong>the</strong> USGS National Mapping Division(NMD) (Fegeas <strong>and</strong> o<strong>the</strong>rs, 1983) as part of a largenational l<strong>and</strong>-use data-base coverage; <strong>the</strong>re<strong>for</strong>e, l<strong>and</strong>useclassifications <strong>for</strong> <strong>the</strong> Willamette River Basin arenot specific. For different categories of agriculturall<strong>and</strong>s, <strong>for</strong> example, <strong>the</strong> distinctions between irrigated<strong>and</strong> nonirrigated cropl<strong>and</strong>s are not indicated; similarly,cropl<strong>and</strong>s are not classified separately from orchards.L<strong>and</strong>-use classes included in <strong>the</strong> basin data layer usedin this study were Forest, Agriculture, Urban, Wetl<strong>and</strong>,Lakes <strong>and</strong> Reservoirs, Canals <strong>and</strong> Streams, <strong>and</strong>Rangel<strong>and</strong> (table 3). Forest, Agriculture, <strong>and</strong> Urbanareas were <strong>the</strong> dominant classes throughout <strong>the</strong> basin.All <strong>for</strong>est l<strong>and</strong> was considered to be predominantlyconifer, because <strong>the</strong>re are no large st<strong>and</strong>s of deciduous<strong>for</strong>est. Figure 6 shows l<strong>and</strong>-use classifications <strong>for</strong> <strong>the</strong>Molalla River Basin.Slope <strong>and</strong> aspect—A slope data layer <strong>for</strong> <strong>the</strong>entire river basin was created from elevation data containedin a 1:250,000 scale DEM (U.S. GeologicalSurvey, 1990). The DEM data were used to create apolygon data layer of slope containing three slopeclasses: 0 to 5 percent, 5 to 30 percent, <strong>and</strong> greaterthan 30 percent. For slopes greater than 30 percent,polygons were created to represent <strong>the</strong> four aspects ofnorth, east, south, <strong>and</strong> west. For slopes less than 30percent, statistical programs within <strong>the</strong> GIS computeda dominant aspect <strong>for</strong> each HRU. Statistical programswithin <strong>the</strong> GIS also computed average elevation <strong>for</strong>each HRU. Figure 6 shows <strong>the</strong> slope <strong>and</strong> aspect classifications<strong>for</strong> <strong>the</strong> Molalla River Basin.Geology—The surficial geology data layer wasdigitized from a 1:500,000-scale USGS aquifer-units13