Precipitation-Runoff and Streamflow-Routing Models for the ...
Precipitation-Runoff and Streamflow-Routing Models for the ...
Precipitation-Runoff and Streamflow-Routing Models for the ...
- No tags were found...

Create successful ePaper yourself
Turn your PDF publications into a flip-book with our unique Google optimized e-Paper software.
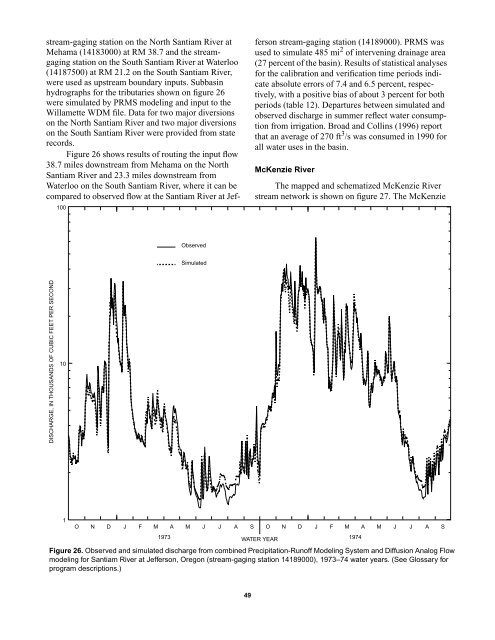
100stream-gaging station on <strong>the</strong> North Santiam River atMehama (14183000) at RM 38.7 <strong>and</strong> <strong>the</strong> streamgagingstation on <strong>the</strong> South Santiam River at Waterloo(14187500) at RM 21.2 on <strong>the</strong> South Santiam River,were used as upstream boundary inputs. Subbasinhydrographs <strong>for</strong> <strong>the</strong> tributaries shown on figure 26were simulated by PRMS modeling <strong>and</strong> input to <strong>the</strong>Willamette WDM file. Data <strong>for</strong> two major diversionson <strong>the</strong> North Santiam River <strong>and</strong> two major diversionson <strong>the</strong> South Santiam River were provided from staterecords.Figure 26 shows results of routing <strong>the</strong> input flow38.7 miles downstream from Mehama on <strong>the</strong> NorthSantiam River <strong>and</strong> 23.3 miles downstream fromWaterloo on <strong>the</strong> South Santiam River, where it can becompared to observed flow at <strong>the</strong> Santiam River at Jeffersonstream-gaging station (14189000). PRMS wasused to simulate 485 mi 2 of intervening drainage area(27 percent of <strong>the</strong> basin). Results of statistical analyses<strong>for</strong> <strong>the</strong> calibration <strong>and</strong> verification time periods indicateabsolute errors of 7.4 <strong>and</strong> 6.5 percent, respectively,with a positive bias of about 3 percent <strong>for</strong> bothperiods (table 12). Departures between simulated <strong>and</strong>observed discharge in summer reflect water consumptionfrom irrigation. Broad <strong>and</strong> Collins (1996) reportthat an average of 270 ft 3 /s was consumed in 1990 <strong>for</strong>all water uses in <strong>the</strong> basin.McKenzie RiverThe mapped <strong>and</strong> schematized McKenzie Riverstream network is shown on figure 27. The McKenzieObservedSimulatedDISCHARGE, IN THOUSANDS OF CUBIC FEET PER SECOND101O N D J F M A M J J A S O N D J F M A M J J A S1973 WATER YEAR1974Figure 26. Observed <strong>and</strong> simulated discharge from combined <strong>Precipitation</strong>-<strong>Runoff</strong> Modeling System <strong>and</strong> Diffusion Analog Flowmodeling <strong>for</strong> Santiam River at Jefferson, Oregon (stream-gaging station 14189000), 1973–74 water years. (See Glossary <strong>for</strong>program descriptions.)49