made on <strong>the</strong> main stem at base-flow periods in <strong>the</strong>spring <strong>and</strong> in late summer to better define groundwaterflow contributions to streams of <strong>the</strong> WillametteRiver Basin.Spatial data layers of l<strong>and</strong> use, soils, geology,topography, <strong>and</strong> precipitation were used to define <strong>the</strong>basic computational unit <strong>for</strong> PRMS—<strong>the</strong> uniquehydrologic response unit (HRU). The WillametteRiver Basin was partitioned into 21 major tributarybasins, each defining a major tributary inflow to <strong>the</strong>main stem or an intervening segment between majortributary inflows. The major tributary basins were fur<strong>the</strong>rdivided into 253 subbasins. Each subbasin hadfrom 2 to 12 individual HRU’s, which collectivelynumbered approximately 1,000 basinwide.To obtain <strong>the</strong> most complete data set <strong>for</strong> modelcalibration <strong>and</strong> verification, time-series climate <strong>and</strong>streamflow data were assembled <strong>for</strong> water years 1972–78. This period had <strong>the</strong> greatest number of operationalstream-gaging stations in <strong>the</strong> Willamette River Basin.Daily precipitation <strong>and</strong> air temperature data were compiled<strong>for</strong> 52 wea<strong>the</strong>r stations, <strong>and</strong> daily streamflowdata were compiled <strong>for</strong> 31 streamflow stations. Hourlyhydrographs <strong>for</strong> 5 major storms <strong>for</strong> 22 of <strong>the</strong> streamgaging-stationlocations were also compiled <strong>for</strong> subsequentuse in storm modeling.A computer program was written to convertspatial-data coverage in<strong>for</strong>mation into specific PRMSmodel parameter values. Spatial data were input to ageographic in<strong>for</strong>mation system (GIS) that was used todefine average annual precipitation (<strong>and</strong> subsequently,to compute a precipitation weighting factor <strong>for</strong> eachHRU <strong>for</strong> application to observed data from a specificrain gage location) <strong>and</strong> physiographic parameters suchas elevation, slope, aspect, soil, vegetation, geology,<strong>and</strong> total drainage area <strong>for</strong> each HRU. Tables wereused to cross reference specific physical modelparametervalues related to interception, evapotranspiration,infiltration, <strong>and</strong> runoff to codes identified in <strong>the</strong>HRU data layer. For each subbasin or tributary basin,43 parameter values <strong>for</strong> each HRU were written to afile used by <strong>the</strong> runoff model.To determine PRMS parameter values <strong>for</strong>ungaged areas, runoff models <strong>for</strong> 10 unregulatedbasins that have historic streamflow records were calibrated.The PRMS user’s manual (Leavesley <strong>and</strong> o<strong>the</strong>rs,1983) should be used with this report documentationto fully underst<strong>and</strong> <strong>the</strong> precipitation-runoffmodels used in <strong>the</strong> study. Most model parameters hadvalues that were assigned on <strong>the</strong> basis of geographicin<strong>for</strong>mation <strong>and</strong> field <strong>and</strong> laboratory data; however, 11model parameters were optimized during model calibration.Five of <strong>the</strong> optimized parameters were givenregionally constant values, but values <strong>for</strong> five o<strong>the</strong>rparameters describing subsurface <strong>and</strong> ground-waterflow were obtained by using values from <strong>the</strong> calibrationbasin having characteristics that best matched <strong>the</strong>characteristics of <strong>the</strong> ungaged basin. The remainingparameter value was an overall adjustment to rainfallto accommodate <strong>the</strong> water balance <strong>and</strong> was applied inaddition to <strong>the</strong> individual HRU precipitation adjustment.Equations that relate cross-sectional area <strong>and</strong>width to discharge were defined <strong>for</strong> stream-reachsegments located at approximately 3-mile intervals on<strong>the</strong> main stem <strong>and</strong> all major tributaries of <strong>the</strong> WillametteRiver. The <strong>for</strong>m of <strong>the</strong>se equations is given inAppendix 1. Time-of-travel measurements definecross sections at low flow, when pools <strong>and</strong> riffles are<strong>the</strong> hydraulic controls. Cross sections measured atstream-gaging-station locations <strong>and</strong> <strong>for</strong> flood reports(U.S. Army Corps of Engineers, 1968–1972) definehigh flow conditions when channel roughness is <strong>the</strong>primary hydraulic control. Approximately 760 milesof main stem <strong>and</strong> tributary geometry was described atintervals of about 3 miles (Appendix 1).<strong>Streamflow</strong>-routing models were constructedusing <strong>the</strong> Diffusion Analogy Flow model (DAFLOW)(Jobson, 1989) to simulate <strong>the</strong> different stream networksin <strong>the</strong> Willamette River Basin. In runningDAFLOW, it was necessary to define inflow hydrographsat <strong>the</strong> upstream boundary of <strong>the</strong> network <strong>and</strong>all tributary <strong>and</strong> diversion hydrographs at intermediatepoints. Upstream boundary hydrographs were fromexisting stream-gaging-station data, <strong>and</strong> tributaryhydrographs were from runoff-model simulations oftributary basins. The user’s manual <strong>for</strong> DAFLOW(Jobson, 1989) should be used in conjunction with thisreport to fully underst<strong>and</strong> <strong>the</strong> flow-routing system.Eleven network models, each consisting of severalprecipitation-runoff models linked to a streamflowroutingmodel, were constructed <strong>and</strong> verified.As an example application <strong>for</strong> water-quality simulation,<strong>the</strong> Branched Lagrangian Transport Model(BLTM) (Jobson <strong>and</strong> Schoellhamer, 1987) was calibrated<strong>and</strong> used to simulate dye concentrations. Dyeconcentration data were from time-of-travel studies.Flow hydrographs used in simulations were fromstreamflow-routing <strong>and</strong> precipitation-runoff models.4
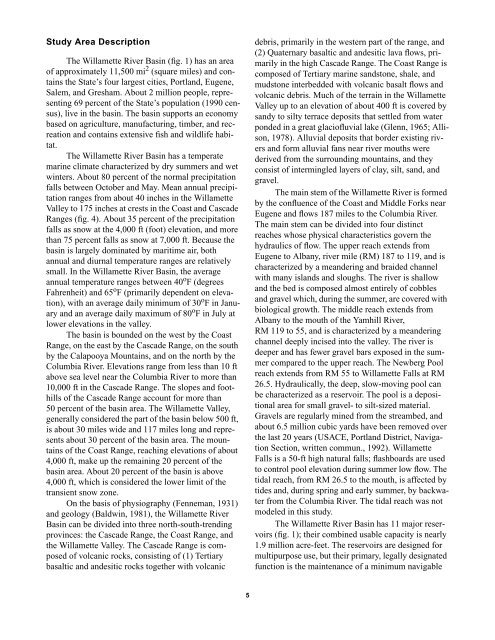
Study Area DescriptionThe Willamette River Basin (fig. 1) has an areaof approximately 11,500 mi 2 (square miles) <strong>and</strong> contains<strong>the</strong> State’s four largest cities, Portl<strong>and</strong>, Eugene,Salem, <strong>and</strong> Gresham. About 2 million people, representing69 percent of <strong>the</strong> State’s population (1990 census),live in <strong>the</strong> basin. The basin supports an economybased on agriculture, manufacturing, timber, <strong>and</strong> recreation<strong>and</strong> contains extensive fish <strong>and</strong> wildlife habitat.The Willamette River Basin has a temperatemarine climate characterized by dry summers <strong>and</strong> wetwinters. About 80 percent of <strong>the</strong> normal precipitationfalls between October <strong>and</strong> May. Mean annual precipitationranges from about 40 inches in <strong>the</strong> WillametteValley to 175 inches at crests in <strong>the</strong> Coast <strong>and</strong> CascadeRanges (fig. 4). About 35 percent of <strong>the</strong> precipitationfalls as snow at <strong>the</strong> 4,000 ft (foot) elevation, <strong>and</strong> morethan 75 percent falls as snow at 7,000 ft. Because <strong>the</strong>basin is largely dominated by maritime air, bothannual <strong>and</strong> diurnal temperature ranges are relativelysmall. In <strong>the</strong> Willamette River Basin, <strong>the</strong> averageannual temperature ranges between 40 o F (degreesFahrenheit) <strong>and</strong> 65 o F (primarily dependent on elevation),with an average daily minimum of 30 o F in January<strong>and</strong> an average daily maximum of 80 o F in July atlower elevations in <strong>the</strong> valley.The basin is bounded on <strong>the</strong> west by <strong>the</strong> CoastRange, on <strong>the</strong> east by <strong>the</strong> Cascade Range, on <strong>the</strong> southby <strong>the</strong> Calapooya Mountains, <strong>and</strong> on <strong>the</strong> north by <strong>the</strong>Columbia River. Elevations range from less than 10 ftabove sea level near <strong>the</strong> Columbia River to more than10,000 ft in <strong>the</strong> Cascade Range. The slopes <strong>and</strong> foothillsof <strong>the</strong> Cascade Range account <strong>for</strong> more than50 percent of <strong>the</strong> basin area. The Willamette Valley,generally considered <strong>the</strong> part of <strong>the</strong> basin below 500 ft,is about 30 miles wide <strong>and</strong> 117 miles long <strong>and</strong> representsabout 30 percent of <strong>the</strong> basin area. The mountainsof <strong>the</strong> Coast Range, reaching elevations of about4,000 ft, make up <strong>the</strong> remaining 20 percent of <strong>the</strong>basin area. About 20 percent of <strong>the</strong> basin is above4,000 ft, which is considered <strong>the</strong> lower limit of <strong>the</strong>transient snow zone.On <strong>the</strong> basis of physiography (Fenneman, 1931)<strong>and</strong> geology (Baldwin, 1981), <strong>the</strong> Willamette RiverBasin can be divided into three north-south-trendingprovinces: <strong>the</strong> Cascade Range, <strong>the</strong> Coast Range, <strong>and</strong><strong>the</strong> Willamette Valley. The Cascade Range is composedof volcanic rocks, consisting of (1) Tertiarybasaltic <strong>and</strong> <strong>and</strong>esitic rocks toge<strong>the</strong>r with volcanicdebris, primarily in <strong>the</strong> western part of <strong>the</strong> range, <strong>and</strong>(2) Quaternary basaltic <strong>and</strong> <strong>and</strong>esitic lava flows, primarilyin <strong>the</strong> high Cascade Range. The Coast Range iscomposed of Tertiary marine s<strong>and</strong>stone, shale, <strong>and</strong>mudstone interbedded with volcanic basalt flows <strong>and</strong>volcanic debris. Much of <strong>the</strong> terrain in <strong>the</strong> WillametteValley up to an elevation of about 400 ft is covered bys<strong>and</strong>y to silty terrace deposits that settled from waterponded in a great glaciofluvial lake (Glenn, 1965; Allison,1978). Alluvial deposits that border existing rivers<strong>and</strong> <strong>for</strong>m alluvial fans near river mouths werederived from <strong>the</strong> surrounding mountains, <strong>and</strong> <strong>the</strong>yconsist of intermingled layers of clay, silt, s<strong>and</strong>, <strong>and</strong>gravel.The main stem of <strong>the</strong> Willamette River is <strong>for</strong>medby <strong>the</strong> confluence of <strong>the</strong> Coast <strong>and</strong> Middle Forks nearEugene <strong>and</strong> flows 187 miles to <strong>the</strong> Columbia River.The main stem can be divided into four distinctreaches whose physical characteristics govern <strong>the</strong>hydraulics of flow. The upper reach extends fromEugene to Albany, river mile (RM) 187 to 119, <strong>and</strong> ischaracterized by a me<strong>and</strong>ering <strong>and</strong> braided channelwith many isl<strong>and</strong>s <strong>and</strong> sloughs. The river is shallow<strong>and</strong> <strong>the</strong> bed is composed almost entirely of cobbles<strong>and</strong> gravel which, during <strong>the</strong> summer, are covered withbiological growth. The middle reach extends fromAlbany to <strong>the</strong> mouth of <strong>the</strong> Yamhill River,RM 119 to 55, <strong>and</strong> is characterized by a me<strong>and</strong>eringchannel deeply incised into <strong>the</strong> valley. The river isdeeper <strong>and</strong> has fewer gravel bars exposed in <strong>the</strong> summercompared to <strong>the</strong> upper reach. The Newberg Poolreach extends from RM 55 to Willamette Falls at RM26.5. Hydraulically, <strong>the</strong> deep, slow-moving pool canbe characterized as a reservoir. The pool is a depositionalarea <strong>for</strong> small gravel- to silt-sized material.Gravels are regularly mined from <strong>the</strong> streambed, <strong>and</strong>about 6.5 million cubic yards have been removed over<strong>the</strong> last 20 years (USACE, Portl<strong>and</strong> District, NavigationSection, written commun., 1992). WillametteFalls is a 50-ft high natural falls; flashboards are usedto control pool elevation during summer low flow. Thetidal reach, from RM 26.5 to <strong>the</strong> mouth, is affected bytides <strong>and</strong>, during spring <strong>and</strong> early summer, by backwaterfrom <strong>the</strong> Columbia River. The tidal reach was notmodeled in this study.The Willamette River Basin has 11 major reservoirs(fig. 1); <strong>the</strong>ir combined usable capacity is nearly1.9 million acre-feet. The reservoirs are designed <strong>for</strong>multipurpose use, but <strong>the</strong>ir primary, legally designatedfunction is <strong>the</strong> maintenance of a minimum navigable5
- Page 1: Precipitation-Runoff and Streamflow
- Page 4 and 5: U.S. DEPARTMENT OF THE INTERIORBRUC
- Page 6 and 7: Determining Travel Time and Dilutio
- Page 8 and 9: 2. Stream-gaging stations used to c
- Page 10 and 11: Page Intentionally Blank
- Page 12 and 13: network-routing models where availa
- Page 16 and 17: Figure 1. Willamette River Basin, O
- Page 18 and 19: EvapotranspirationINPUTSAirtemperat
- Page 20 and 21: Table 1. Climate stations used to c
- Page 22 and 23: Table 2. Stream-gaging stations use
- Page 24 and 25: Figure 4. Mean annual precipitation
- Page 26 and 27: Major Land Use MapHydrologic Soil G
- Page 28 and 29: 0.5 mi 2 , created in the merge of
- Page 30 and 31: Table 6. Geology and soils matrix o
- Page 32 and 33: tion value of the HRU class by the
- Page 34 and 35: Table 8. Selected monthly basinwide
- Page 36 and 37: Figure 9. Location of Precipitation
- Page 38 and 39: Table 11. Statistical analyses of P
- Page 40 and 41: flow can become a significant compo
- Page 42 and 43: diffusion at selected grid interval
- Page 44 and 45: samples were collected at various d
- Page 46 and 47: 3,0002,500June 21-30, 1993September
- Page 48 and 49: stream network is shown on figure 1
- Page 50 and 51: 122˚30´ 15´122˚00´121˚45´Roc
- Page 52 and 53: 123˚22´30´´ 123˚15´ 123˚00´
- Page 54 and 55: 123˚00´´ 45´30´122˚15´45˚15
- Page 56 and 57: YamhillRiver123˚45´ 30´ 15´123
- Page 58 and 59: 123˚07´30´´ 123˚00´ 45´ 30´
- Page 60 and 61: 123˚07´30´´ 123˚00´ 45´ 30´
- Page 62 and 63: 44˚15´14166000122˚07´30´´Will
- Page 64 and 65:
122˚15´ 122˚00´121˚52´30´´4
- Page 66 and 67:
44˚52´30´´45´122˚15´ 122˚00
- Page 68 and 69:
observed flow at the Willamette Riv
- Page 70 and 71:
DAFLOW model, and peak amplitude is
- Page 72 and 73:
20DYE CONCENTRATION, IN MICROGRAMS
- Page 74 and 75:
ARC-INFO and Geographic Information
- Page 76 and 77:
WILL.WDMData-base file(Observed pre
- Page 78 and 79:
WILL.WDMData-base fileSWSTATSFreque
- Page 80 and 81:
Jobson, H.E., 1980, Comment on A ne
- Page 82 and 83:
Page Intentionally Blank
- Page 84 and 85:
APPENDIX 1. STREAM GEOMETRY FOR MAI
- Page 86 and 87:
APPENDIX 1. STREAM GEOMETRY FOR MAI
- Page 88 and 89:
APPENDIX 1. STREAM GEOMETRY FOR MAI
- Page 90 and 91:
APPENDIX 1. STREAM GEOMETRY FOR MAI
- Page 92 and 93:
APPENDIX 1. STREAM GEOMETRY FOR MAI
- Page 94 and 95:
APPENDIX 1. STREAM GEOMETRY FOR MAI
- Page 96 and 97:
APPENDIX 1. STREAM GEOMETRY FOR MAI
- Page 98 and 99:
APPENDIX 1. STREAM GEOMETRY FOR MAI
- Page 100 and 101:
APPENDIX 1. STREAM GEOMETRY FOR MAI
- Page 102 and 103:
APPENDIX 1. STREAM GEOMETRY FOR MAI
- Page 104 and 105:
APPENDIX 1. STREAM GEOMETRY FOR MAI
- Page 106 and 107:
APPENDIX 1. STREAM GEOMETRY FOR MAI
- Page 108 and 109:
APPENDIX 1. STREAM GEOMETRY FOR MAI
- Page 110 and 111:
APPENDIX 2. ARC MACRO LANGUAGE (AML
- Page 112 and 113:
APPENDIX 2. ARC MACRO LANGUAGE (AML
- Page 114 and 115:
APPENDIX 2. ARC MACRO LANGUAGE (AML
- Page 116 and 117:
APPENDIX 2. ARC MACRO LANGUAGE (AML
- Page 118 and 119:
APPENDIX 2. ARC MACRO LANGUAGE (AML
- Page 120 and 121:
APPENDIX 2. ARC MACRO LANGUAGE (AML
- Page 122 and 123:
APPENDIX 3. DEFINITIONS OF PARAMETE
- Page 124 and 125:
APPENDIX 3. DEFINITIONS OF PARAMETE
- Page 126 and 127:
APPENDIX 4. MEASUREMENTS USED TO DE
- Page 128 and 129:
APPENDIX 4. MEASUREMENTS USED TO DE
- Page 130 and 131:
APPENDIX 4. MEASUREMENTS USED TO DE
- Page 132 and 133:
APPENDIX 4. MEASUREMENTS USED TO DE
- Page 134 and 135:
APPENDIX 5. EXAMPLE PRECIPITATION-R
- Page 136 and 137:
APPENDIX 5. EXAMPLE PRECIPITATION-R
- Page 138 and 139:
APPENDIX 6. DIFFUSION ANALOGY FLOW
- Page 140 and 141:
APPENDIX 6. DIFFUSION ANALOGY FLOW
- Page 142 and 143:
APPENDIX 6. DIFFUSION ANALOGY FLOW
- Page 144 and 145:
APPENDIX 6. DIFFUSION ANALOGY FLOW
- Page 146 and 147:
APPENDIX 6. DIFFUSION ANALOGY FLOW
- Page 148 and 149:
APPENDIX 6. DIFFUSION ANALOGY FLOW
- Page 150 and 151:
APPENDIX 7. PROGRAMMING STEPS TO IN
- Page 152 and 153:
APPENDIX 8. PROGRAMMING STEPS TO DE
- Page 154 and 155:
APPENDIX 8. PROGRAMMING STEPS TO DE
- Page 156 and 157:
APPENDIX 8. PROGRAMMING STEPS TO DE
- Page 158 and 159:
APPENDIX 8. PROGRAMMING STEPS TO DE
- Page 160 and 161:
150Climatemaxtempmintempprecipitati
- Page 162 and 163:
APPENDIX 10. DIRECTORY TREE AND DES
- Page 164 and 165:
APPENDIX 10. DIRECTORY TREE AND DES
- Page 166 and 167:
APPENDIX 10. DIRECTORY TREE AND DES
- Page 168 and 169:
APPENDIX 10. DIRECTORY TREE AND DES
- Page 170 and 171:
APPENDIX 10. DIRECTORY TREE AND DES
- Page 172 and 173:
APPENDIX 10. DIRECTORY TREE AND DES
- Page 174 and 175:
APPENDIX 10. DIRECTORY TREE AND DES
- Page 176 and 177:
APPENDIX 10. DIRECTORY TREE AND DES
- Page 178 and 179:
APPENDIX 10. DIRECTORY TREE AND DES
- Page 180 and 181:
APPENDIX 11. DIRECTORY TREES AND DE
- Page 182 and 183:
APPENDIX 11. DIRECTORY TREES AND DE
- Page 184 and 185:
APPENDIX 12. DIRECTORY FOR will.wdm
- Page 186 and 187:
APPENDIX 12. DIRECTORY FOR will.wdm
- Page 188 and 189:
APPENDIX 12. DIRECTORY FOR will.wdm
- Page 190 and 191:
APPENDIX 12. DIRECTORY FOR will.wdm
- Page 192 and 193:
APPENDIX 12. DIRECTORY FOR will.wdm
- Page 194 and 195:
APPENDIX 12. DIRECTORY FOR will.wdm
- Page 196 and 197:
APPENDIX 13. PROGRAMMING STEPS FOR
- Page 198 and 199:
APPENDIX 13. PROGRAMMING STEPS FOR
- Page 200 and 201:
APPENDIX 13. PROGRAMMING STEPS FOR
- Page 202 and 203:
APPENDIX 14. INPUT FILES FOR BRANCH
- Page 204 and 205:
APPENDIX 14. INPUT FILES FOR BRANCH
- Page 206 and 207:
APPENDIX 14. INPUT FILES FOR BRANCH