Precipitation-Runoff and Streamflow-Routing Models for the ...
Precipitation-Runoff and Streamflow-Routing Models for the ...
Precipitation-Runoff and Streamflow-Routing Models for the ...
- No tags were found...

You also want an ePaper? Increase the reach of your titles
YUMPU automatically turns print PDFs into web optimized ePapers that Google loves.
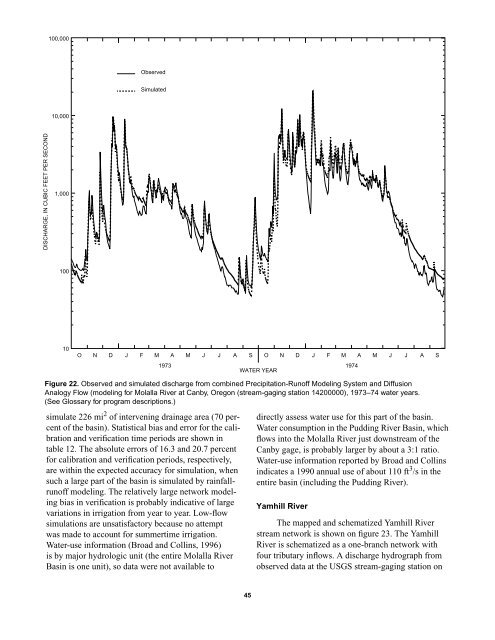
100,000ObservedSimulated10,000DISCHARGE, IN CUBIC FEET PER SECOND1,00010010O N D J F M A M J J A S O N D J F M A M J J A S1973 1974WATER YEARFigure 22. Observed <strong>and</strong> simulated discharge from combined <strong>Precipitation</strong>-<strong>Runoff</strong> Modeling System <strong>and</strong> DiffusionAnalogy Flow (modeling <strong>for</strong> Molalla River at Canby, Oregon (stream-gaging station 14200000), 1973–74 water years.(See Glossary <strong>for</strong> program descriptions.)simulate 226 mi 2 of intervening drainage area (70 percentof <strong>the</strong> basin). Statistical bias <strong>and</strong> error <strong>for</strong> <strong>the</strong> calibration<strong>and</strong> verification time periods are shown intable 12. The absolute errors of 16.3 <strong>and</strong> 20.7 percent<strong>for</strong> calibration <strong>and</strong> verification periods, respectively,are within <strong>the</strong> expected accuracy <strong>for</strong> simulation, whensuch a large part of <strong>the</strong> basin is simulated by rainfallrunoffmodeling. The relatively large network modelingbias in verification is probably indicative of largevariations in irrigation from year to year. Low-flowsimulations are unsatisfactory because no attemptwas made to account <strong>for</strong> summertime irrigation.Water-use in<strong>for</strong>mation (Broad <strong>and</strong> Collins, 1996)is by major hydrologic unit (<strong>the</strong> entire Molalla RiverBasin is one unit), so data were not available todirectly assess water use <strong>for</strong> this part of <strong>the</strong> basin.Water consumption in <strong>the</strong> Pudding River Basin, whichflows into <strong>the</strong> Molalla River just downstream of <strong>the</strong>Canby gage, is probably larger by about a 3:1 ratio.Water-use in<strong>for</strong>mation reported by Broad <strong>and</strong> Collinsindicates a 1990 annual use of about 110 ft 3 /s in <strong>the</strong>entire basin (including <strong>the</strong> Pudding River).Yamhill RiverThe mapped <strong>and</strong> schematized Yamhill Riverstream network is shown on figure 23. The YamhillRiver is schematized as a one-branch network withfour tributary inflows. A discharge hydrograph fromobserved data at <strong>the</strong> USGS stream-gaging station on45