Precipitation-Runoff and Streamflow-Routing Models for the ...
Precipitation-Runoff and Streamflow-Routing Models for the ...
Precipitation-Runoff and Streamflow-Routing Models for the ...
- No tags were found...

Create successful ePaper yourself
Turn your PDF publications into a flip-book with our unique Google optimized e-Paper software.
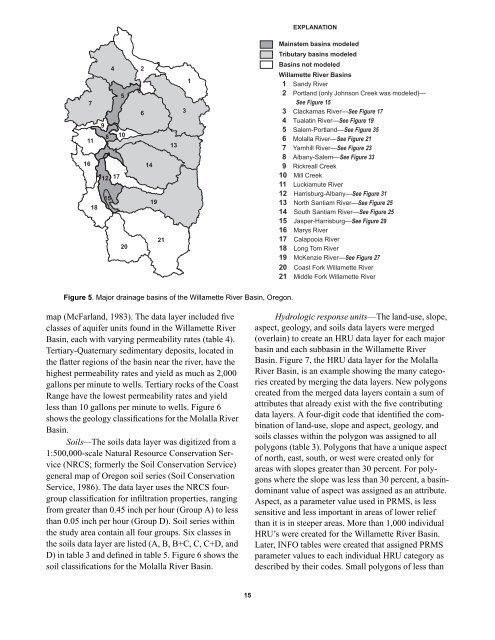
EXPLANATIONMainstem basins modeledTributary basins modeledBasins not modeledWillamette River Basins1 S<strong>and</strong>y River2 Portl<strong>and</strong> (only Johnson Creek was modeled)—See Figure 153 Clackamas River—SeeFigure174 Tualatin River—See Figure 195 Salem-Portl<strong>and</strong>—See Figure 356 Molalla River—See Figure 217 Yamhill River—See Figure 238 Albany-Salem—SeeFigure339 Rickreall Creek10 Mill Creek11 Luckiamute River12 Harrisburg-Albany—See Figure 3113 North Santiam River—See Figure 2514 South Santiam River—See Figure 2515 Jasper-Harrisburg—SeeFigure2916 Marys River17 Calapooia River18 Long Tom River19 McKenzie River—SeeFigure2720 Coast Fork Willamette River21 Middle Fork Willamette River71116184598 1012 171520261419211331Figure 5. Major drainage basins of <strong>the</strong> Willamette River Basin, Oregon.map (McFarl<strong>and</strong>, 1983). The data layer included fiveclasses of aquifer units found in <strong>the</strong> Willamette RiverBasin, each with varying permeability rates (table 4).Tertiary-Quaternary sedimentary deposits, located in<strong>the</strong> flatter regions of <strong>the</strong> basin near <strong>the</strong> river, have <strong>the</strong>highest permeability rates <strong>and</strong> yield as much as 2,000gallons per minute to wells. Tertiary rocks of <strong>the</strong> CoastRange have <strong>the</strong> lowest permeability rates <strong>and</strong> yieldless than 10 gallons per minute to wells. Figure 6shows <strong>the</strong> geology classifications <strong>for</strong> <strong>the</strong> Molalla RiverBasin.Soils—The soils data layer was digitized from a1:500,000-scale Natural Resource Conservation Service(NRCS; <strong>for</strong>merly <strong>the</strong> Soil Conservation Service)general map of Oregon soil series (Soil ConservationService, 1986). The data layer uses <strong>the</strong> NRCS fourgroupclassification <strong>for</strong> infiltration properties, rangingfrom greater than 0.45 inch per hour (Group A) to lessthan 0.05 inch per hour (Group D). Soil series within<strong>the</strong> study area contain all four groups. Six classes in<strong>the</strong> soils data layer are listed (A, B, B+C, C, C+D, <strong>and</strong>D) in table 3 <strong>and</strong> defined in table 5. Figure 6 shows <strong>the</strong>soil classifications <strong>for</strong> <strong>the</strong> Molalla River Basin.Hydrologic response units—The l<strong>and</strong>-use, slope,aspect, geology, <strong>and</strong> soils data layers were merged(overlain) to create an HRU data layer <strong>for</strong> each majorbasin <strong>and</strong> each subbasin in <strong>the</strong> Willamette RiverBasin. Figure 7, <strong>the</strong> HRU data layer <strong>for</strong> <strong>the</strong> MolallaRiver Basin, is an example showing <strong>the</strong> many categoriescreated by merging <strong>the</strong> data layers. New polygonscreated from <strong>the</strong> merged data layers contain a sum ofattributes that already exist with <strong>the</strong> five contributingdata layers. A four-digit code that identified <strong>the</strong> combinationof l<strong>and</strong>-use, slope <strong>and</strong> aspect, geology, <strong>and</strong>soils classes within <strong>the</strong> polygon was assigned to allpolygons (table 3). Polygons that have a unique aspectof north, east, south, or west were created only <strong>for</strong>areas with slopes greater than 30 percent. For polygonswhere <strong>the</strong> slope was less than 30 percent, a basindominantvalue of aspect was assigned as an attribute.Aspect, as a parameter value used in PRMS, is lesssensitive <strong>and</strong> less important in areas of lower reliefthan it is in steeper areas. More than 1,000 individualHRU’s were created <strong>for</strong> <strong>the</strong> Willamette River Basin.Later, INFO tables were created that assigned PRMSparameter values to each individual HRU category asdescribed by <strong>the</strong>ir codes. Small polygons of less than15