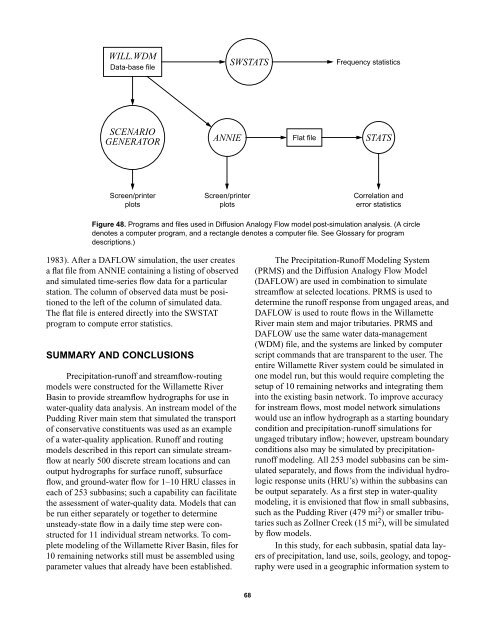
WILL.WDMData-base fileSWSTATSFrequency statisticsSCENARIOGENERATORANNIEFlat fileSTATSScreen/printerplotsScreen/printerplotsCorrelation <strong>and</strong>error statisticsFigure 48. Programs <strong>and</strong> files used in Diffusion Analogy Flow model post-simulation analysis. (A circledenotes a computer program, <strong>and</strong> a rectangle denotes a computer file. See Glossary <strong>for</strong> programdescriptions.)1983). After a DAFLOW simulation, <strong>the</strong> user createsa flat file from ANNIE containing a listing of observed<strong>and</strong> simulated time-series flow data <strong>for</strong> a particularstation. The column of observed data must be positionedto <strong>the</strong> left of <strong>the</strong> column of simulated data.The flat file is entered directly into <strong>the</strong> SWSTATprogram to compute error statistics.SUMMARY AND CONCLUSIONS<strong>Precipitation</strong>-runoff <strong>and</strong> streamflow-routingmodels were constructed <strong>for</strong> <strong>the</strong> Willamette RiverBasin to provide streamflow hydrographs <strong>for</strong> use inwater-quality data analysis. An instream model of <strong>the</strong>Pudding River main stem that simulated <strong>the</strong> transportof conservative constituents was used as an exampleof a water-quality application. <strong>Runoff</strong> <strong>and</strong> routingmodels described in this report can simulate streamflowat nearly 500 discrete stream locations <strong>and</strong> canoutput hydrographs <strong>for</strong> surface runoff, subsurfaceflow, <strong>and</strong> ground-water flow <strong>for</strong> 1–10 HRU classes ineach of 253 subbasins; such a capability can facilitate<strong>the</strong> assessment of water-quality data. <strong>Models</strong> that canbe run ei<strong>the</strong>r separately or toge<strong>the</strong>r to determineunsteady-state flow in a daily time step were constructed<strong>for</strong> 11 individual stream networks. To completemodeling of <strong>the</strong> Willamette River Basin, files <strong>for</strong>10 remaining networks still must be assembled usingparameter values that already have been established.The <strong>Precipitation</strong>-<strong>Runoff</strong> Modeling System(PRMS) <strong>and</strong> <strong>the</strong> Diffusion Analogy Flow Model(DAFLOW) are used in combination to simulatestreamflow at selected locations. PRMS is used todetermine <strong>the</strong> runoff response from ungaged areas, <strong>and</strong>DAFLOW is used to route flows in <strong>the</strong> WillametteRiver main stem <strong>and</strong> major tributaries. PRMS <strong>and</strong>DAFLOW use <strong>the</strong> same water data-management(WDM) file, <strong>and</strong> <strong>the</strong> systems are linked by computerscript comm<strong>and</strong>s that are transparent to <strong>the</strong> user. Theentire Willamette River system could be simulated inone model run, but this would require completing <strong>the</strong>setup of 10 remaining networks <strong>and</strong> integrating <strong>the</strong>minto <strong>the</strong> existing basin network. To improve accuracy<strong>for</strong> instream flows, most model network simulationswould use an inflow hydrograph as a starting boundarycondition <strong>and</strong> precipitation-runoff simulations <strong>for</strong>ungaged tributary inflow; however, upstream boundaryconditions also may be simulated by precipitationrunoffmodeling. All 253 model subbasins can be simulatedseparately, <strong>and</strong> flows from <strong>the</strong> individual hydrologicresponse units (HRU’s) within <strong>the</strong> subbasins canbe output separately. As a first step in water-qualitymodeling, it is envisioned that flow in small subbasins,such as <strong>the</strong> Pudding River (479 mi 2 ) or smaller tributariessuch as Zollner Creek (15 mi 2 ), will be simulatedby flow models.In this study, <strong>for</strong> each subbasin, spatial data layersof precipitation, l<strong>and</strong> use, soils, geology, <strong>and</strong> topographywere used in a geographic in<strong>for</strong>mation system to68
define <strong>the</strong> homogeneous hydrologic response units(HRU’s), which are <strong>the</strong> basic computational units ofPRMS. These spatial data were used by an Arc MacroLanguage (AML) program to produce model inputvalues representing interception, evapotranspiration,infiltration, <strong>and</strong> subsurface <strong>and</strong> ground-water flowrates. This AML program can be used at any time in<strong>the</strong> future to redefine model parameters with newer<strong>and</strong> better defined spatial data layers. It is envisionedthat redefining HRU’s (<strong>for</strong> example, dividing agriculturall<strong>and</strong> into finer units that delineate crop types)will be done first <strong>for</strong> small drainages in order to evaluate<strong>the</strong>ir significance in evaluating water-quality datadifferences.<strong>Precipitation</strong>-runoff model calibrations <strong>and</strong> verificationswere done <strong>for</strong> <strong>the</strong> 1972–78 period, becausethis was <strong>the</strong> period of greatest streamflow record density.More than one-half <strong>the</strong> stream-gaging stations inoperation from 1972–78 in <strong>the</strong> Willamette River Basinare no longer in operation. For future simulation offlows <strong>for</strong> o<strong>the</strong>r periods, <strong>the</strong> data base must be updatedwith precipitation, temperature, <strong>and</strong> flow data <strong>for</strong> <strong>the</strong>intended simulation time. Network accuracy dependson <strong>the</strong> proportion of <strong>the</strong> basin that has been simulatedwith precipitation-runoff models. For example, to estimateflow in <strong>the</strong> Molalla River at Canby, <strong>the</strong> 70 percentof <strong>the</strong> basin that was ungaged had to be simulatedwith precipitation <strong>and</strong> temperature data. The simulationresulted in a flow estimate with an average absoluteerror of about 21 percent. In a network whereflows are primarily routed, <strong>the</strong> Willamette River(Albany to Salem) network, only 9 percent of <strong>the</strong>basin had to be simulated with precipitation <strong>and</strong> temperaturedata, resulting in a flow estimate with anaverage absolute error of about 4 percent.The Branched Lagrangian Transport Model(BLTM) <strong>and</strong> DAFLOW were used to simulate <strong>the</strong> dispersionof dye in <strong>the</strong> main stem of <strong>the</strong> Pudding Riverto give an example of a water-quality application <strong>and</strong>to show model linkages. For water-quality modelingin <strong>the</strong> Willamette River Basin, <strong>the</strong> data generated bydye studies conducted <strong>for</strong> this project still must beused in <strong>the</strong> calibration of o<strong>the</strong>r stream networks.Dye modeling in <strong>the</strong> Pudding River has resultedin a close fit to observed data; however, this may notprove to be <strong>the</strong> case <strong>for</strong> all streams. The Pudding Riverhas a streambed that consists of fine material, <strong>and</strong><strong>the</strong>re is little transfer between <strong>the</strong> stream <strong>and</strong> <strong>the</strong>ground-water system. As evidenced in <strong>the</strong> gain-lossinvestigations made in <strong>the</strong> Willamette River, o<strong>the</strong>rstreams can have a large exchange of water occurringbetween <strong>the</strong> river <strong>and</strong> <strong>the</strong> streambed. The BLTM modelprobably will yield less accurate results in streams thatexhibit a large exchange of water between river <strong>and</strong>streambed; however, <strong>the</strong> differences that occur can giveinsight to <strong>the</strong> contributing volumes from <strong>the</strong>seexchanges <strong>and</strong> identify <strong>the</strong> fluxes needed in modelapplication.REFERENCES CITEDAllison, I.S., 1978, Late Pleistocene sediments <strong>and</strong> floods in<strong>the</strong> Willamette Valley: The Ore Bin, v. 40, p. 177–202.Baldwin, E.M., 1981, Geology of Oregon: Dubuque, Iowa,Kendall/Hunt Publishing Co., 170 p.Broad, T.M., <strong>and</strong> Collins, C.A., 1996, Estimated water use<strong>and</strong> general hydrologic conditions <strong>for</strong> Oregon, 1985 <strong>and</strong>1990: U.S. Geological Survey Water-Resources InvestigationsReport 96–4080, 166 p.Chow, V.T., 1964, H<strong>and</strong>book of applied hydrology: NewYork, McGraw-Hill, [variously paginated].Daly, C., <strong>and</strong> Neilson, R.P., <strong>and</strong> Phillips, V.L., 1994, Astatistical-topographic model <strong>for</strong> estimating climatologicalprecipitation over mountainous terrain: Journal ofApplied Meteorology, v. 33, no. 2, p. 140–158.Doyle, W.H, Jr., Shearman, J.O., Stiltner, G.T., <strong>and</strong> Krug,W.R., 1983, A digital model <strong>for</strong> streamflow routing byconvolution methods: U.S. Geological Survey Water-Resources Investigations Report 83–4160, 130 p.Fegeas, R.G., Claire, R.W., Guptill, S.C., Anderson, K.E.,<strong>and</strong> Hallam, C.A., 1983, L<strong>and</strong> use <strong>and</strong> l<strong>and</strong> coverdigital data: U.S. Geological Survey Circular 895–E,30 p.Fenneman, N.M., 1931, Physiography of <strong>the</strong> Western UnitedStates: New York <strong>and</strong> London, McGraw-Hill BookCompany, Inc., 534 p.Glenn, J.L., 1965, Late Quaternary sedimentation <strong>and</strong>geologic history of <strong>the</strong> north Willamette valley,Oregon: Corvallis, Oregon State University, Ph.D.dissertation, 231 p.Hamon, W.R., 1961, Estimating potential evapotranspiration:Proceedings of <strong>the</strong> American Society of Civil Engineers,Journal of Hydraulic Division, v. 87, no. HY3, p.107–120.Harris, D.D., 1968, Travel rates of water <strong>for</strong> selected streamsin <strong>the</strong> Willamette River basin, Oregon: U.S. GeologicalSurvey Hydrologic Investigations Atlas HA–273.Hubbard, E.F., Kilpatrick, F.A., Martens, L.A., <strong>and</strong> Wilson,J.F., Jr., 1982, Measurement of time of travel <strong>and</strong> dispersionin streams by dye tracing: U.S. GeologicalSurvey Techniques of Water-Resources Investigations,chapter A9, book 3, 44 p.69
- Page 1:
Precipitation-Runoff and Streamflow
- Page 4 and 5:
U.S. DEPARTMENT OF THE INTERIORBRUC
- Page 6 and 7:
Determining Travel Time and Dilutio
- Page 8 and 9:
2. Stream-gaging stations used to c
- Page 10 and 11:
Page Intentionally Blank
- Page 12 and 13:
network-routing models where availa
- Page 14 and 15:
made on the main stem at base-flow
- Page 16 and 17:
Figure 1. Willamette River Basin, O
- Page 18 and 19:
EvapotranspirationINPUTSAirtemperat
- Page 20 and 21:
Table 1. Climate stations used to c
- Page 22 and 23:
Table 2. Stream-gaging stations use
- Page 24 and 25:
Figure 4. Mean annual precipitation
- Page 26 and 27:
Major Land Use MapHydrologic Soil G
- Page 28 and 29: 0.5 mi 2 , created in the merge of
- Page 30 and 31: Table 6. Geology and soils matrix o
- Page 32 and 33: tion value of the HRU class by the
- Page 34 and 35: Table 8. Selected monthly basinwide
- Page 36 and 37: Figure 9. Location of Precipitation
- Page 38 and 39: Table 11. Statistical analyses of P
- Page 40 and 41: flow can become a significant compo
- Page 42 and 43: diffusion at selected grid interval
- Page 44 and 45: samples were collected at various d
- Page 46 and 47: 3,0002,500June 21-30, 1993September
- Page 48 and 49: stream network is shown on figure 1
- Page 50 and 51: 122˚30´ 15´122˚00´121˚45´Roc
- Page 52 and 53: 123˚22´30´´ 123˚15´ 123˚00´
- Page 54 and 55: 123˚00´´ 45´30´122˚15´45˚15
- Page 56 and 57: YamhillRiver123˚45´ 30´ 15´123
- Page 58 and 59: 123˚07´30´´ 123˚00´ 45´ 30´
- Page 60 and 61: 123˚07´30´´ 123˚00´ 45´ 30´
- Page 62 and 63: 44˚15´14166000122˚07´30´´Will
- Page 64 and 65: 122˚15´ 122˚00´121˚52´30´´4
- Page 66 and 67: 44˚52´30´´45´122˚15´ 122˚00
- Page 68 and 69: observed flow at the Willamette Riv
- Page 70 and 71: DAFLOW model, and peak amplitude is
- Page 72 and 73: 20DYE CONCENTRATION, IN MICROGRAMS
- Page 74 and 75: ARC-INFO and Geographic Information
- Page 76 and 77: WILL.WDMData-base file(Observed pre
- Page 80 and 81: Jobson, H.E., 1980, Comment on A ne
- Page 82 and 83: Page Intentionally Blank
- Page 84 and 85: APPENDIX 1. STREAM GEOMETRY FOR MAI
- Page 86 and 87: APPENDIX 1. STREAM GEOMETRY FOR MAI
- Page 88 and 89: APPENDIX 1. STREAM GEOMETRY FOR MAI
- Page 90 and 91: APPENDIX 1. STREAM GEOMETRY FOR MAI
- Page 92 and 93: APPENDIX 1. STREAM GEOMETRY FOR MAI
- Page 94 and 95: APPENDIX 1. STREAM GEOMETRY FOR MAI
- Page 96 and 97: APPENDIX 1. STREAM GEOMETRY FOR MAI
- Page 98 and 99: APPENDIX 1. STREAM GEOMETRY FOR MAI
- Page 100 and 101: APPENDIX 1. STREAM GEOMETRY FOR MAI
- Page 102 and 103: APPENDIX 1. STREAM GEOMETRY FOR MAI
- Page 104 and 105: APPENDIX 1. STREAM GEOMETRY FOR MAI
- Page 106 and 107: APPENDIX 1. STREAM GEOMETRY FOR MAI
- Page 108 and 109: APPENDIX 1. STREAM GEOMETRY FOR MAI
- Page 110 and 111: APPENDIX 2. ARC MACRO LANGUAGE (AML
- Page 112 and 113: APPENDIX 2. ARC MACRO LANGUAGE (AML
- Page 114 and 115: APPENDIX 2. ARC MACRO LANGUAGE (AML
- Page 116 and 117: APPENDIX 2. ARC MACRO LANGUAGE (AML
- Page 118 and 119: APPENDIX 2. ARC MACRO LANGUAGE (AML
- Page 120 and 121: APPENDIX 2. ARC MACRO LANGUAGE (AML
- Page 122 and 123: APPENDIX 3. DEFINITIONS OF PARAMETE
- Page 124 and 125: APPENDIX 3. DEFINITIONS OF PARAMETE
- Page 126 and 127: APPENDIX 4. MEASUREMENTS USED TO DE
- Page 128 and 129:
APPENDIX 4. MEASUREMENTS USED TO DE
- Page 130 and 131:
APPENDIX 4. MEASUREMENTS USED TO DE
- Page 132 and 133:
APPENDIX 4. MEASUREMENTS USED TO DE
- Page 134 and 135:
APPENDIX 5. EXAMPLE PRECIPITATION-R
- Page 136 and 137:
APPENDIX 5. EXAMPLE PRECIPITATION-R
- Page 138 and 139:
APPENDIX 6. DIFFUSION ANALOGY FLOW
- Page 140 and 141:
APPENDIX 6. DIFFUSION ANALOGY FLOW
- Page 142 and 143:
APPENDIX 6. DIFFUSION ANALOGY FLOW
- Page 144 and 145:
APPENDIX 6. DIFFUSION ANALOGY FLOW
- Page 146 and 147:
APPENDIX 6. DIFFUSION ANALOGY FLOW
- Page 148 and 149:
APPENDIX 6. DIFFUSION ANALOGY FLOW
- Page 150 and 151:
APPENDIX 7. PROGRAMMING STEPS TO IN
- Page 152 and 153:
APPENDIX 8. PROGRAMMING STEPS TO DE
- Page 154 and 155:
APPENDIX 8. PROGRAMMING STEPS TO DE
- Page 156 and 157:
APPENDIX 8. PROGRAMMING STEPS TO DE
- Page 158 and 159:
APPENDIX 8. PROGRAMMING STEPS TO DE
- Page 160 and 161:
150Climatemaxtempmintempprecipitati
- Page 162 and 163:
APPENDIX 10. DIRECTORY TREE AND DES
- Page 164 and 165:
APPENDIX 10. DIRECTORY TREE AND DES
- Page 166 and 167:
APPENDIX 10. DIRECTORY TREE AND DES
- Page 168 and 169:
APPENDIX 10. DIRECTORY TREE AND DES
- Page 170 and 171:
APPENDIX 10. DIRECTORY TREE AND DES
- Page 172 and 173:
APPENDIX 10. DIRECTORY TREE AND DES
- Page 174 and 175:
APPENDIX 10. DIRECTORY TREE AND DES
- Page 176 and 177:
APPENDIX 10. DIRECTORY TREE AND DES
- Page 178 and 179:
APPENDIX 10. DIRECTORY TREE AND DES
- Page 180 and 181:
APPENDIX 11. DIRECTORY TREES AND DE
- Page 182 and 183:
APPENDIX 11. DIRECTORY TREES AND DE
- Page 184 and 185:
APPENDIX 12. DIRECTORY FOR will.wdm
- Page 186 and 187:
APPENDIX 12. DIRECTORY FOR will.wdm
- Page 188 and 189:
APPENDIX 12. DIRECTORY FOR will.wdm
- Page 190 and 191:
APPENDIX 12. DIRECTORY FOR will.wdm
- Page 192 and 193:
APPENDIX 12. DIRECTORY FOR will.wdm
- Page 194 and 195:
APPENDIX 12. DIRECTORY FOR will.wdm
- Page 196 and 197:
APPENDIX 13. PROGRAMMING STEPS FOR
- Page 198 and 199:
APPENDIX 13. PROGRAMMING STEPS FOR
- Page 200 and 201:
APPENDIX 13. PROGRAMMING STEPS FOR
- Page 202 and 203:
APPENDIX 14. INPUT FILES FOR BRANCH
- Page 204 and 205:
APPENDIX 14. INPUT FILES FOR BRANCH
- Page 206 and 207:
APPENDIX 14. INPUT FILES FOR BRANCH