- Page 1:
Precipitation-Runoff and Streamflow
- Page 4 and 5:
U.S. DEPARTMENT OF THE INTERIORBRUC
- Page 6 and 7: Determining Travel Time and Dilutio
- Page 8 and 9: 2. Stream-gaging stations used to c
- Page 10 and 11: Page Intentionally Blank
- Page 12 and 13: network-routing models where availa
- Page 14 and 15: made on the main stem at base-flow
- Page 16 and 17: Figure 1. Willamette River Basin, O
- Page 18 and 19: EvapotranspirationINPUTSAirtemperat
- Page 20 and 21: Table 1. Climate stations used to c
- Page 22 and 23: Table 2. Stream-gaging stations use
- Page 24 and 25: Figure 4. Mean annual precipitation
- Page 26 and 27: Major Land Use MapHydrologic Soil G
- Page 28 and 29: 0.5 mi 2 , created in the merge of
- Page 30 and 31: Table 6. Geology and soils matrix o
- Page 32 and 33: tion value of the HRU class by the
- Page 34 and 35: Table 8. Selected monthly basinwide
- Page 36 and 37: Figure 9. Location of Precipitation
- Page 38 and 39: Table 11. Statistical analyses of P
- Page 40 and 41: flow can become a significant compo
- Page 42 and 43: diffusion at selected grid interval
- Page 44 and 45: samples were collected at various d
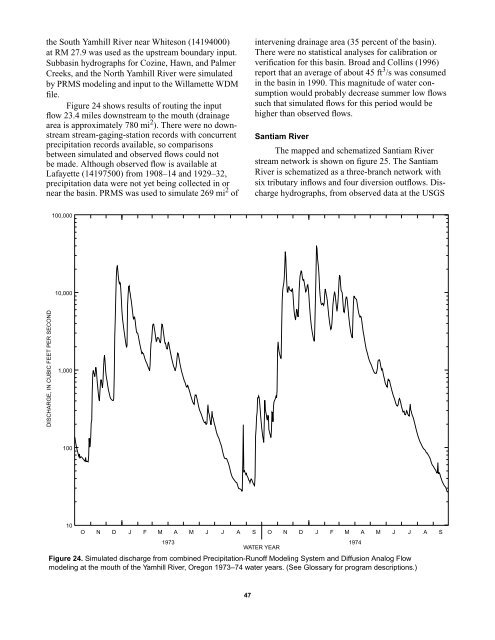
- Page 46 and 47: 3,0002,500June 21-30, 1993September
- Page 48 and 49: stream network is shown on figure 1
- Page 50 and 51: 122˚30´ 15´122˚00´121˚45´Roc
- Page 52 and 53: 123˚22´30´´ 123˚15´ 123˚00´
- Page 54 and 55: 123˚00´´ 45´30´122˚15´45˚15
- Page 58 and 59: 123˚07´30´´ 123˚00´ 45´ 30´
- Page 60 and 61: 123˚07´30´´ 123˚00´ 45´ 30´
- Page 62 and 63: 44˚15´14166000122˚07´30´´Will
- Page 64 and 65: 122˚15´ 122˚00´121˚52´30´´4
- Page 66 and 67: 44˚52´30´´45´122˚15´ 122˚00
- Page 68 and 69: observed flow at the Willamette Riv
- Page 70 and 71: DAFLOW model, and peak amplitude is
- Page 72 and 73: 20DYE CONCENTRATION, IN MICROGRAMS
- Page 74 and 75: ARC-INFO and Geographic Information
- Page 76 and 77: WILL.WDMData-base file(Observed pre
- Page 78 and 79: WILL.WDMData-base fileSWSTATSFreque
- Page 80 and 81: Jobson, H.E., 1980, Comment on A ne
- Page 82 and 83: Page Intentionally Blank
- Page 84 and 85: APPENDIX 1. STREAM GEOMETRY FOR MAI
- Page 86 and 87: APPENDIX 1. STREAM GEOMETRY FOR MAI
- Page 88 and 89: APPENDIX 1. STREAM GEOMETRY FOR MAI
- Page 90 and 91: APPENDIX 1. STREAM GEOMETRY FOR MAI
- Page 92 and 93: APPENDIX 1. STREAM GEOMETRY FOR MAI
- Page 94 and 95: APPENDIX 1. STREAM GEOMETRY FOR MAI
- Page 96 and 97: APPENDIX 1. STREAM GEOMETRY FOR MAI
- Page 98 and 99: APPENDIX 1. STREAM GEOMETRY FOR MAI
- Page 100 and 101: APPENDIX 1. STREAM GEOMETRY FOR MAI
- Page 102 and 103: APPENDIX 1. STREAM GEOMETRY FOR MAI
- Page 104 and 105: APPENDIX 1. STREAM GEOMETRY FOR MAI
- Page 106 and 107:
APPENDIX 1. STREAM GEOMETRY FOR MAI
- Page 108 and 109:
APPENDIX 1. STREAM GEOMETRY FOR MAI
- Page 110 and 111:
APPENDIX 2. ARC MACRO LANGUAGE (AML
- Page 112 and 113:
APPENDIX 2. ARC MACRO LANGUAGE (AML
- Page 114 and 115:
APPENDIX 2. ARC MACRO LANGUAGE (AML
- Page 116 and 117:
APPENDIX 2. ARC MACRO LANGUAGE (AML
- Page 118 and 119:
APPENDIX 2. ARC MACRO LANGUAGE (AML
- Page 120 and 121:
APPENDIX 2. ARC MACRO LANGUAGE (AML
- Page 122 and 123:
APPENDIX 3. DEFINITIONS OF PARAMETE
- Page 124 and 125:
APPENDIX 3. DEFINITIONS OF PARAMETE
- Page 126 and 127:
APPENDIX 4. MEASUREMENTS USED TO DE
- Page 128 and 129:
APPENDIX 4. MEASUREMENTS USED TO DE
- Page 130 and 131:
APPENDIX 4. MEASUREMENTS USED TO DE
- Page 132 and 133:
APPENDIX 4. MEASUREMENTS USED TO DE
- Page 134 and 135:
APPENDIX 5. EXAMPLE PRECIPITATION-R
- Page 136 and 137:
APPENDIX 5. EXAMPLE PRECIPITATION-R
- Page 138 and 139:
APPENDIX 6. DIFFUSION ANALOGY FLOW
- Page 140 and 141:
APPENDIX 6. DIFFUSION ANALOGY FLOW
- Page 142 and 143:
APPENDIX 6. DIFFUSION ANALOGY FLOW
- Page 144 and 145:
APPENDIX 6. DIFFUSION ANALOGY FLOW
- Page 146 and 147:
APPENDIX 6. DIFFUSION ANALOGY FLOW
- Page 148 and 149:
APPENDIX 6. DIFFUSION ANALOGY FLOW
- Page 150 and 151:
APPENDIX 7. PROGRAMMING STEPS TO IN
- Page 152 and 153:
APPENDIX 8. PROGRAMMING STEPS TO DE
- Page 154 and 155:
APPENDIX 8. PROGRAMMING STEPS TO DE
- Page 156 and 157:
APPENDIX 8. PROGRAMMING STEPS TO DE
- Page 158 and 159:
APPENDIX 8. PROGRAMMING STEPS TO DE
- Page 160 and 161:
150Climatemaxtempmintempprecipitati
- Page 162 and 163:
APPENDIX 10. DIRECTORY TREE AND DES
- Page 164 and 165:
APPENDIX 10. DIRECTORY TREE AND DES
- Page 166 and 167:
APPENDIX 10. DIRECTORY TREE AND DES
- Page 168 and 169:
APPENDIX 10. DIRECTORY TREE AND DES
- Page 170 and 171:
APPENDIX 10. DIRECTORY TREE AND DES
- Page 172 and 173:
APPENDIX 10. DIRECTORY TREE AND DES
- Page 174 and 175:
APPENDIX 10. DIRECTORY TREE AND DES
- Page 176 and 177:
APPENDIX 10. DIRECTORY TREE AND DES
- Page 178 and 179:
APPENDIX 10. DIRECTORY TREE AND DES
- Page 180 and 181:
APPENDIX 11. DIRECTORY TREES AND DE
- Page 182 and 183:
APPENDIX 11. DIRECTORY TREES AND DE
- Page 184 and 185:
APPENDIX 12. DIRECTORY FOR will.wdm
- Page 186 and 187:
APPENDIX 12. DIRECTORY FOR will.wdm
- Page 188 and 189:
APPENDIX 12. DIRECTORY FOR will.wdm
- Page 190 and 191:
APPENDIX 12. DIRECTORY FOR will.wdm
- Page 192 and 193:
APPENDIX 12. DIRECTORY FOR will.wdm
- Page 194 and 195:
APPENDIX 12. DIRECTORY FOR will.wdm
- Page 196 and 197:
APPENDIX 13. PROGRAMMING STEPS FOR
- Page 198 and 199:
APPENDIX 13. PROGRAMMING STEPS FOR
- Page 200 and 201:
APPENDIX 13. PROGRAMMING STEPS FOR
- Page 202 and 203:
APPENDIX 14. INPUT FILES FOR BRANCH
- Page 204 and 205:
APPENDIX 14. INPUT FILES FOR BRANCH
- Page 206 and 207:
APPENDIX 14. INPUT FILES FOR BRANCH