Precipitation-Runoff and Streamflow-Routing Models for the ...
Precipitation-Runoff and Streamflow-Routing Models for the ...
Precipitation-Runoff and Streamflow-Routing Models for the ...
- No tags were found...

You also want an ePaper? Increase the reach of your titles
YUMPU automatically turns print PDFs into web optimized ePapers that Google loves.
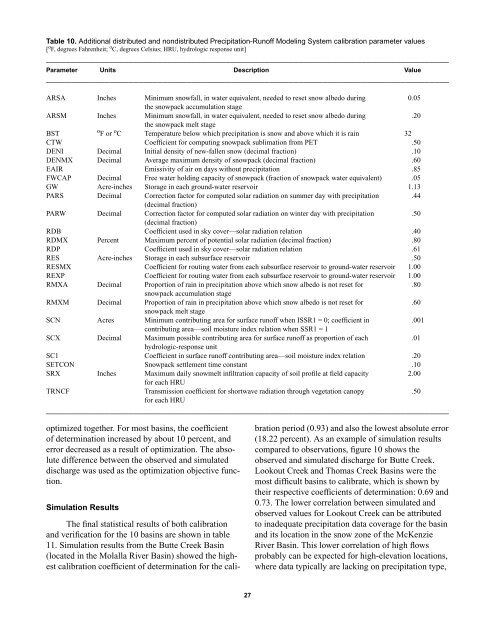
Table 10. Additional distributed <strong>and</strong> nondistributed <strong>Precipitation</strong>-<strong>Runoff</strong> Modeling System calibration parameter values[ o F, degrees Fahrenheit; o C, degrees Celsius; HRU, hydrologic response unit]___________________________________________________________________________________Parameter Units Description Value___________________________________________________________________________________ARSA Inches Minimum snowfall, in water equivalent, needed to reset snow albedo during 0.05<strong>the</strong> snowpack accumulation stageARSM Inches Minimum snowfall, in water equivalent, needed to reset snow albedo during .20<strong>the</strong> snowpack melt stageBST o F or o C Temperature below which precipitation is snow <strong>and</strong> above which it is rain 32CTW Coefficient <strong>for</strong> computing snowpack sublimation from PET .50DENI Decimal Initial density of new-fallen snow (decimal fraction) .10DENMX Decimal Average maximum density of snowpack (decimal fraction) .60EAIR Emissivity of air on days without precipitation .85FWCAP Decimal Free water holding capacity of snowpack (fraction of snowpack water equivalent) .05GW Acre-inches Storage in each ground-water reservoir 1.13PARS Decimal Correction factor <strong>for</strong> computed solar radiation on summer day with precipitation .44(decimal fraction)PARW Decimal Correction factor <strong>for</strong> computed solar radiation on winter day with precipitation .50(decimal fraction)RDB Coefficient used in sky cover—solar radiation relation .40RDMX Percent Maximum percent of potential solar radiation (decimal fraction) .80RDP Coefficient used in sky cover—solar radiation relation .61RES Acre-inches Storage in each subsurface reservoir .50RESMX Coefficient <strong>for</strong> routing water from each subsurface reservoir to ground-water reservoir 1.00REXP Coefficient <strong>for</strong> routing water from each subsurface reservoir to ground-water reservoir 1.00RMXA Decimal Proportion of rain in precipitation above which snow albedo is not reset <strong>for</strong> .80snowpack accumulation stageRMXM Decimal Proportion of rain in precipitation above which snow albedo is not reset <strong>for</strong> .60snowpack melt stageSCN Acres Minimum contributing area <strong>for</strong> surface runoff when ISSR1 = 0; coefficient in .001contributing area—soil moisture index relation when SSR1 = 1SCX Decimal Maximum possible contributing area <strong>for</strong> surface runoff as proportion of each .01hydrologic-response unitSC1 Coefficient in surface runoff contributing area—soil moisture index relation .20SETCON Snowpack settlement time constant .10SRX Inches Maximum daily snowmelt infiltration capacity of soil profile at field capacity 2.00<strong>for</strong> each HRUTRNCF Transmission coefficient <strong>for</strong> shortwave radiation through vegetation canopy .50<strong>for</strong> each HRU___________________________________________________________________________________optimized toge<strong>the</strong>r. For most basins, <strong>the</strong> coefficientof determination increased by about 10 percent, <strong>and</strong>error decreased as a result of optimization. The absolutedifference between <strong>the</strong> observed <strong>and</strong> simulateddischarge was used as <strong>the</strong> optimization objective function.Simulation ResultsThe final statistical results of both calibration<strong>and</strong> verification <strong>for</strong> <strong>the</strong> 10 basins are shown in table11. Simulation results from <strong>the</strong> Butte Creek Basin(located in <strong>the</strong> Molalla River Basin) showed <strong>the</strong> highestcalibration coefficient of determination <strong>for</strong> <strong>the</strong> calibrationperiod (0.93) <strong>and</strong> also <strong>the</strong> lowest absolute error(18.22 percent). As an example of simulation resultscompared to observations, figure 10 shows <strong>the</strong>observed <strong>and</strong> simulated discharge <strong>for</strong> Butte Creek.Lookout Creek <strong>and</strong> Thomas Creek Basins were <strong>the</strong>most difficult basins to calibrate, which is shown by<strong>the</strong>ir respective coefficients of determination: 0.69 <strong>and</strong>0.73. The lower correlation between simulated <strong>and</strong>observed values <strong>for</strong> Lookout Creek can be attributedto inadequate precipitation data coverage <strong>for</strong> <strong>the</strong> basin<strong>and</strong> its location in <strong>the</strong> snow zone of <strong>the</strong> McKenzieRiver Basin. This lower correlation of high flowsprobably can be expected <strong>for</strong> high-elevation locations,where data typically are lacking on precipitation type,27