

Here - Stuff
Here - Stuff
Here - Stuff

Create successful ePaper yourself
Turn your PDF publications into a flip-book with our unique Google optimized e-Paper software.
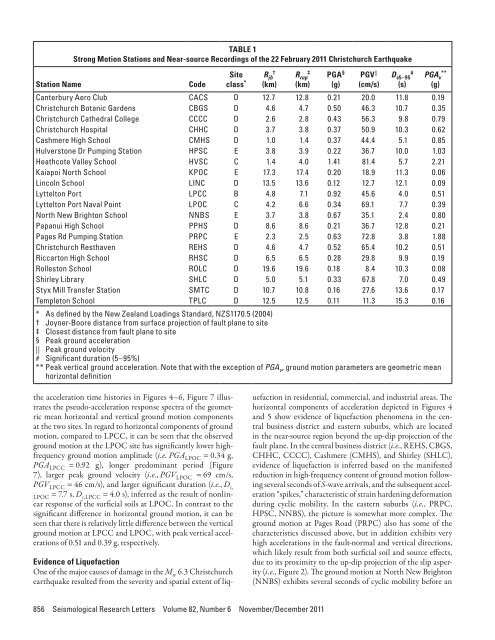
Station NameTABLE 1Strong Motion Stations and Near-source Recordings of the 22 February 2011 Christchurch EarthquakeCodeSiteclass * R jb†(km)R rup‡(km)PGA §(g)PGV ||(cm/s)D s5–95#(s)PGA v**(g)Canterbury Aero Club CACS D 12.7 12.8 0.21 20.0 11.8 0.19Christchurch Botanic Gardens CBGS D 4.6 4.7 0.50 46.3 10.7 0.35Christchurch Cathedral College CCCC D 2.6 2.8 0.43 56.3 9.8 0.79Christchurch Hospital CHHC D 3.7 3.8 0.37 50.9 10.3 0.62Cashmere High School CMHS D 1.0 1.4 0.37 44.4 5.1 0.85Hulverstone Dr Pumping Station HPSC E 3.8 3.9 0.22 36.7 10.0 1.03Heathcote Valley School HVSC C 1.4 4.0 1.41 81.4 5.7 2.21Kaiapoi North School KPOC E 17.3 17.4 0.20 18.9 11.3 0.06Lincoln School LINC D 13.5 13.6 0.12 12.7 12.1 0.09Lyttelton Port LPCC B 4.8 7.1 0.92 45.6 4.0 0.51Lyttelton Port Naval Point LPOC C 4.2 6.6 0.34 69.1 7.7 0.39North New Brighton School NNBS E 3.7 3.8 0.67 35.1 2.4 0.80Papanui High School PPHS D 8.6 8.6 0.21 36.7 12.8 0.21Pages Rd Pumping Station PRPC E 2.3 2.5 0.63 72.8 3.8 1.88Christchurch Resthaven REHS D 4.6 4.7 0.52 65.4 10.2 0.51Riccarton High School RHSC D 6.5 6.5 0.28 29.8 9.9 0.19Rolleston School ROLC D 19.6 19.6 0.18 8.4 10.3 0.08Shirley Library SHLC D 5.0 5.1 0.33 67.8 7.0 0.49Styx Mill Transfer Station SMTC D 10.7 10.8 0.16 27.6 13.6 0.17Templeton School TPLC D 12.5 12.5 0.11 11.3 15.3 0.16* As defined by the New Zealand Loadings Standard, NZS1170.5 (2004)† Joyner-Boore distance from surface projection of fault plane to site‡ Closest distance from fault plane to site§ Peak ground acceleration|| Peak ground velocity# Significant duration (5–95%)** Peak vertical ground acceleration. Note that with the exception of PGA v , ground motion parameters are geometric meanhorizontal definitionthe acceleration time histories in Figures 4–6, Figure 7 illustratesthe pseudo-acceleration response spectra of the geometricmean horizontal and vertical ground motion componentsat the two sites. In regard to horizontal components of groundmotion, compared to LPCC, it can be seen that the observedground motion at the LPOC site has significantly lower highfrequencyground motion amplitude (i.e. PGA LPOC = 0.34 g,PGA LPCC = 0.92 g), longer predominant period (Figure7), larger peak ground velocity (i.e., PGV LPOC = 69 cm/s,PGV LPCC = 46 cm/s), and larger significant duration (i.e., D s,LPOC = 7.7 s, D s,LPCC = 4.0 s), inferred as the result of nonlinearresponse of the surficial soils at LPOC. In contrast to thesignificant difference in horizontal ground motion, it can beseen that there is relatively little difference between the verticalground motion at LPCC and LPOC, with peak vertical accelerationsof 0.51 and 0.39 g, respectively.Evidence of LiquefactionOne of the major causes of damage in the M w 6.3 Christchurchearthquake resulted from the severity and spatial extent of liquefactionin residential, commercial, and industrial areas. Thehorizontal components of acceleration depicted in Figures 4and 5 show evidence of liquefaction phenomena in the centralbusiness district and eastern suburbs, which are locatedin the near-source region beyond the up-dip projection of thefault plane. In the central business district (i.e., REHS, CBGS,CHHC, CCCC), Cashmere (CMHS), and Shirley (SHLC),evidence of liquefaction is inferred based on the manifestedreduction in high-frequency content of ground motion followingseveral seconds of S-wave arrivals, and the subsequent acceleration“spikes,” characteristic of strain hardening deformationduring cyclic mobility. In the eastern suburbs (i.e., PRPC,HPSC, NNBS), the picture is somewhat more complex. Theground motion at Pages Road (PRPC) also has some of thecharacteristics discussed above, but in addition exhibits veryhigh accelerations in the fault-normal and vertical directions,which likely result from both surficial soil and source effects,due to its proximity to the up-dip projection of the slip asperity(i.e., Figure 2). The ground motion at North New Brighton(NNBS) exhibits several seconds of cyclic mobility before an856 Seismological Research Letters Volume 82, Number 6 November/December 2011


