- Page 1: Volume 82, Number 6 November/Decemb
- Page 7: News and Notes (continued)Nominatio
- Page 11: Preface to the Focused Issue on the
- Page 14 and 15: TABLE 1Peak ground acceleration (PG
- Page 16 and 17: ▲▲Figure 2. A) Sketch of the
- Page 18 and 19: ▲▲Figure 4. A) Adopted moment r
- Page 20 and 21: ▲▲Figure 7. As in Figure 6 but
- Page 22 and 23: ▲ ▲ Figure 8. Misfit parameters
- Page 24 and 25: ▲ ▲ Figure 10. Spatial variabil
- Page 26 and 27: ▲ ▲ Figure 12. Standard spectra
- Page 28 and 29: Quigley, M., R. Van Dissen, P. Vill
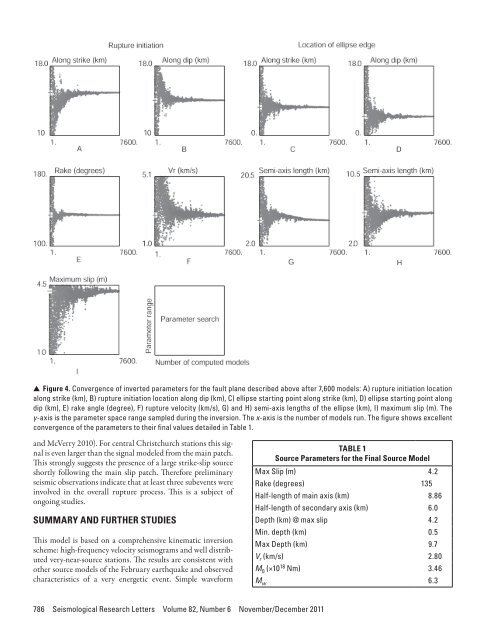
- Page 30 and 31: slip on a 59-degree striking fault
- Page 34 and 35: observations and other source studi
- Page 36 and 37: -42. 5-43. 0-43. 5-44. 0-44. 5-43.2
- Page 38 and 39: “Product CSK © ASI, (ItalianSpac
- Page 40 and 41: TABLE 2Solutions for fault location
- Page 42 and 43: -43.45(A)degrees N-43.50-43.552.52.
- Page 44 and 45: is still a good fit to the horizont
- Page 46 and 47: Coulomb Stress Change Sensitivity d
- Page 48 and 49: mation takes on a larger strike-sli
- Page 50 and 51: P 9.4267BLDU45P 20.1213CASY39P 2.62
- Page 52 and 53: ERMJNUMAJOINUJHJ2CBIJMIDWJOWYHNBTPU
- Page 54 and 55: (A)6.146.13(B)6.246.36Misfit6.156.1
- Page 56 and 57: (A)(B)(C)(D)▲▲Figure 10. The co
- Page 58 and 59: (A)(B)(C)(D)▲▲Figure 12. The co
- Page 60 and 61: Luo, Y., Y. Tan, S. Wei, D. Helmber
- Page 62 and 63: −44˚00' −43˚00'4-Sep-2010Mw 7
- Page 64 and 65: TABLE 1Pairs of SAR imagery used in
- Page 67 and 68: Depth (km)Coulomb Stress Change(bar
- Page 69 and 70: Crippen, R. E. (1992). Measurement
- Page 71 and 72: AlpineFaultHope Fault38 mm/yr0+ +-1
- Page 73 and 74: σ 1dσ 3Nuσ 3CM w 7.1dw 6.2u70°M
- Page 75 and 76: Right-lateral Faults(A) Range Front
- Page 77 and 78: DISCUSSIONThe 2010-2011 Canterbury
- Page 79 and 80: Large Apparent Stresses from the Ca
- Page 81 and 82: ▲ ▲ Figure 2. Observed vs. pred
- Page 83 and 84:
10Obs SA(1s)AS1AS+SDAB 2006AB+SDSA(
- Page 85 and 86:
Fine-scale Relocation of Aftershock
- Page 87 and 88:
−43.25°OXZ0 10 20km−43.5°−4
- Page 89 and 90:
A’0 km 4 8−43.5°B’B−43.6°
- Page 91 and 92:
REFERENCESAvery, H. R., J. B. Berri
- Page 93 and 94:
▲ ▲ Figure 2. A) shows three-co
- Page 95 and 96:
▲ ▲ Figure 4. Vertical accelera
- Page 97 and 98:
0.8PRPC Z0.40Normalized (Max PGA +
- Page 99 and 100:
Near-source Strong Ground MotionsOb
- Page 101 and 102:
(A)Magnitude, M w876542009 NZdataba
- Page 103 and 104:
Scale0.5 g5 seconds▲▲Figure 4.
- Page 105 and 106:
(A)(B)Spectral Acc, Sa (g)North/Wes
- Page 107 and 108:
Vertical-to-horizontal PGA ratio543
- Page 109 and 110:
(A)(B)Station:CCCCSolid:AvgHorizDas
- Page 111 and 112:
REFERENCESAagaard, B. T., J. F. Hal
- Page 113 and 114:
▲ ▲ Figure 1. Shear-wave veloci
- Page 115 and 116:
Spectral Acceleration (0.3 s), (g)I
- Page 117 and 118:
Spectral Acceleration (3 s), (g)In[
- Page 119 and 120:
TABLE 1Mean (μ LLH ) and standard
- Page 121 and 122:
Strong Ground Motions and Damage Co
- Page 123 and 124:
ings and the Modified Takeda-Slip M
- Page 125 and 126:
high, but there were no buildings d
- Page 127 and 128:
REFERENCES▲▲Figure 8. Heavily d
- Page 129 and 130:
(A)(B)(C)(D)(E)▲▲Figure 1. A) M
- Page 131 and 132:
(A) (B) (C)▲ ▲ Figure 3. A) Typ
- Page 133 and 134:
(A) (B) (C)▲ ▲ Figure 4. A) Typ
- Page 135 and 136:
Case StudyKey ParametersTABLE 1Key
- Page 137 and 138:
▲ ▲ Figure 9. Representative bu
- Page 139 and 140:
Soil Liquefaction Effects in the Ce
- Page 141 and 142:
▲ ▲ Figure 2. Representative su
- Page 143 and 144:
Location of structures illustrated
- Page 145 and 146:
Shading indicates areaover which pr
- Page 147 and 148:
1.8 deg15 cmGround cracking due to
- Page 149 and 150:
30 cm17 cm30 cmFoundation beam▲
- Page 151 and 152:
Comparison of Liquefaction Features
- Page 153 and 154:
(A)(B)▲▲Figure 2. A) Simplified
- Page 155 and 156:
(A)Acceleration (Gal)6004002000-200
- Page 157 and 158:
(A)(B)▲▲Figure 7. Distribution
- Page 159 and 160:
(A)(B)▲▲Figure 10. Damage to a
- Page 161 and 162:
(A)(B)▲ ▲ Figure 14. A) Subside
- Page 163 and 164:
▲▲Figure 17. A trench in a resi
- Page 165 and 166:
Ambient Noise Measurements followin
- Page 167 and 168:
▲▲Figure 1. Location of the noi
- Page 169 and 170:
▲▲Figure 5. Site N20 showing HV
- Page 171 and 172:
▲▲Figure 8. Comparison between
- Page 173 and 174:
Use of DCP and SASW Tests to Evalua
- Page 175 and 176:
▲ ▲ Figure 2. Aerial image of C
- Page 177 and 178:
(A)(B)▲▲Figure 4. DCP test bein
- Page 179 and 180:
▲▲Figure 7. SASW setup at a sit
- Page 181 and 182:
where X ~ N(μ X , σ X 2 ) is shor
- Page 183 and 184:
Using the same critical layers as s
- Page 185 and 186:
Performance of Levees (Stopbanks) d
- Page 187 and 188:
▲▲Figure 3. Typical geometry an
- Page 189 and 190:
TABLE 1Damage severity categories (
- Page 191 and 192:
(A)(B)▲▲Figure 6. A) Large sand
- Page 193 and 194:
(A)(B)▲▲Figure 8. A) Representa
- Page 195 and 196:
each of the Waimakariri River and a
- Page 197 and 198:
▲ ▲ Figure 2. Horizontal peak g
- Page 199 and 200:
only minor damage, mostly to their
- Page 201 and 202:
(A)(C)(B)▲▲Figure 5. Ferrymead
- Page 203 and 204:
(A)(B)▲▲Figure 7. Damage to sou
- Page 205 and 206:
(A)(B)▲▲Figure 11. Settlement o
- Page 207 and 208:
(A)(C)(B)▲▲Figure 14. Railway B
- Page 209 and 210:
Events Reconnaissance (GEER) Associ
- Page 211 and 212:
New PublicationsCanGeoRefThe Americ
- Page 213 and 214:
Wednesday, 18 AprilTechnical Sessio
- Page 215 and 216:
Verification of a Spectral-Element
- Page 217 and 218:
EASTERN SECTIONRESEARCH LETTERSReas
- Page 219 and 220:
(A)70°N100°W 60°W70°N(B)100°E1
- Page 221 and 222:
Mongolia SCRThe presence or absence
- Page 223 and 224:
the small horizontal relative motio
- Page 225 and 226:
80°100°120°140°EXPLANATIONBorde
- Page 227 and 228:
Chang, K. H. (1997). Korean peninsu
- Page 229 and 230:
Wheeler, R. L. (2008). Paleoseismic
- Page 231 and 232:
A significant outcome of this study
- Page 233 and 234:
TABLE 1 (continued)Earthquakes for
- Page 235 and 236:
▲▲Figure 2. Earthquakes used in
- Page 237 and 238:
Meeting CalendarM E E T I N GC A L
- Page 239 and 240:
201 Plaza Professional Bldg. • El
- Page 241 and 242:
Seismological Research Letters (SRL
- Page 243 and 244:
Christa von Hillebrandt-Andrade, Pr