

Here - Stuff
Here - Stuff
Here - Stuff

Create successful ePaper yourself
Turn your PDF publications into a flip-book with our unique Google optimized e-Paper software.
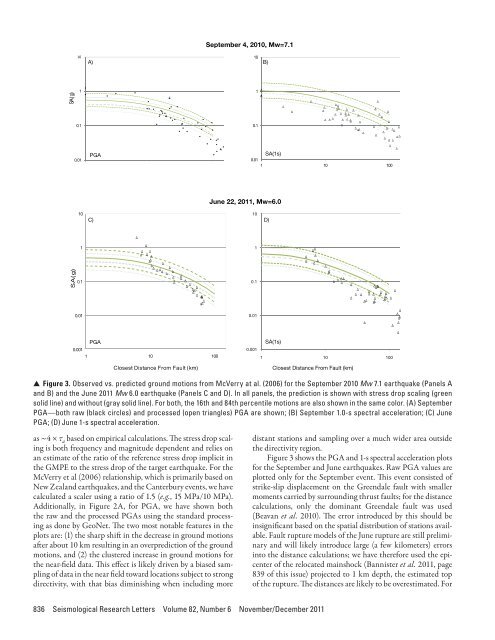
September 4, 2010, Mw=7.11010A) B)SA(g)110.10.10.01PGASA(1s)0.011 10 100June 22, 2011, Mw=6.01010C) D)11SA(g)0.10.10.010.01PGA0.0011 10 100Closest Distance From Fault (km)SA(1s)0.0011 10 100Closest Distance From Fault (km)▲ ▲ Figure 3. Observed vs. predicted ground motions from McVerry at al. (2006) for the September 2010 Mw 7.1 earthquake (Panels Aand B) and the June 2011 Mw 6.0 earthquake (Panels C and D). In all panels, the prediction is shown with stress drop scaling (greensolid line) and without (gray solid line). For both, the 16th and 84th percentile motions are also shown in the same color. (A) SeptemberPGA—both raw (black circles) and processed (open triangles) PGA are shown; (B) September 1.0-s spectral acceleration; (C) JunePGA; (D) June 1-s spectral acceleration.as ~4 × τ a based on empirical calculations. The stress drop scalingis both frequency and magnitude dependent and relies onan estimate of the ratio of the reference stress drop implicit inthe GMPE to the stress drop of the target earthquake. For theMcVerry et al (2006) relationship, which is primarily based onNew Zealand earthquakes, and the Canterbury events, we havecalculated a scaler using a ratio of 1.5 (e.g., 15 MPa/10 MPa).Additionally, in Figure 2A, for PGA, we have shown boththe raw and the processed PGAs using the standard processingas done by GeoNet. The two most notable features in theplots are: (1) the sharp shift in the decrease in ground motionsafter about 10 km resulting in an overprediction of the groundmotions, and (2) the clustered increase in ground motions forthe near-field data. This effect is likely driven by a biased samplingof data in the near field toward locations subject to strongdirectivity, with that bias diminishing when including moredistant stations and sampling over a much wider area outsidethe directivity region.Figure 3 shows the PGA and 1-s spectral acceleration plotsfor the September and June earthquakes. Raw PGA values areplotted only for the September event. This event consisted ofstrike-slip displacement on the Greendale fault with smallermoments carried by surrounding thrust faults; for the distancecalculations, only the dominant Greendale fault was used(Beavan et al. 2010). The error introduced by this should beinsignificant based on the spatial distribution of stations available.Fault rupture models of the June rupture are still preliminaryand will likely introduce large (a few kilometers) errorsinto the distance calculations; we have therefore used the epicenterof the relocated mainshock (Bannister et al. 2011, page839 of this issue) projected to 1 km depth, the estimated topof the rupture. The distances are likely to be overestimated. For836 Seismological Research Letters Volume 82, Number 6 November/December 2011


