

Here - Stuff
Here - Stuff
Here - Stuff

Create successful ePaper yourself
Turn your PDF publications into a flip-book with our unique Google optimized e-Paper software.
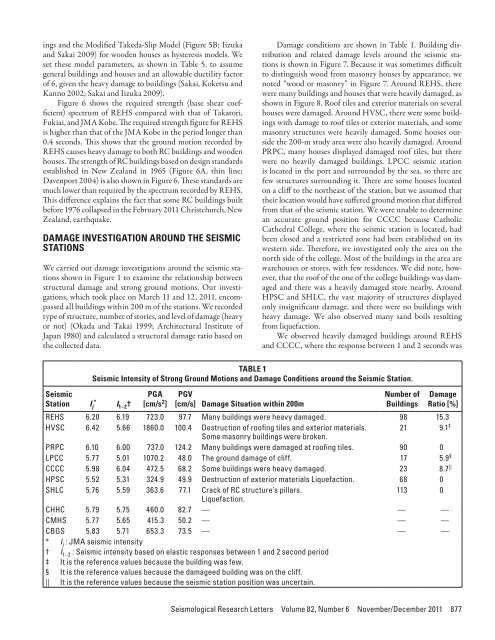
ings and the Modified Takeda-Slip Model (Figure 5B; Iizukaand Sakai 2009) for wooden houses as hysteresis models. Weset these model parameters, as shown in Table 5, to assumegeneral buildings and houses and an allowable ductility factorof 6, given the heavy damage to buildings (Sakai, Koketsu andKanno 2002; Sakai and Iizuka 2009).Figure 6 shows the required strength (base shear coefficient)spectrum of REHS compared with that of Takatori,Fukiai, and JMA Kobe. The required strength figure for REHSis higher than that of the JMA Kobe in the period longer than0.4 seconds. This shows that the ground motion recorded byREHS causes heavy damage to both RC buildings and woodenhouses. The strength of RC buildings based on design standardsestablished in New Zealand in 1965 (Figure 6A, thin line;Davenport 2004) is also shown in Figure 6. These standards aremuch lower than required by the spectrum recorded by REHS.This difference explains the fact that some RC buildings builtbefore 1976 collapsed in the February 2011 Christchurch, NewZealand, earthquake.DAMAGE INVESTIGATION AROUND THE SEISMICSTATIONSWe carried out damage investigations around the seismic stationsshown in Figure 1 to examine the relationship betweenstructural damage and strong ground motions. Our investigations,which took place on March 11 and 12, 2011, encompassedall buildings within 200 m of the stations. We recordedtype of structure, number of stories, and level of damage (heavyor not) (Okada and Takai 1999; Architectural Institute ofJapan 1980) and calculated a structural damage ratio based onthe collected data.Damage conditions are shown in Table 1. Building distributionand related damage levels around the seismic stationsis shown in Figure 7. Because it was sometimes difficultto distinguish wood from masonry houses by appearance, wenoted “wood or masonry” in Figure 7. Around REHS, therewere many buildings and houses that were heavily damaged, asshown in Figure 8. Roof tiles and exterior materials on severalhouses were damaged. Around HVSC, there were some buildingswith damage to roof tiles or exterior materials, and somemasonry structures were heavily damaged. Some houses outsidethe 200-m study area were also heavily damaged. AroundPRPC, many houses displayed damaged roof tiles, but therewere no heavily damaged buildings. LPCC seismic stationis located in the port and surrounded by the sea, so there arefew structures surrounding it. There are some houses locatedon a cliff to the northeast of the station, but we assumed thattheir location would have suffered ground motion that differedfrom that of the seismic station. We were unable to determinean accurate ground position for CCCC because CatholicCathedral College, where the seismic station is located, hadbeen closed and a restricted zone had been established on itswestern side. Therefore, we investigated only the area on thenorth side of the college. Most of the buildings in the area arewarehouses or stores, with few residences. We did note, however,that the roof of the one of the college buildings was damagedand there was a heavily damaged store nearby. AroundHPSC and SHLC, the vast majority of structures displayedonly insignificant damage, and there were no buildings withheavy damage. We also observed many sand boils resultingfrom liquefaction.We observed heavily damaged buildings around REHSand CCCC, where the response between 1 and 2 seconds wasTABLE 1Seismic Intensity of Strong Ground Motions and Damage Conditions around the Seismic Station.SeismicStation I*j I 1–2 †PGA[cm/s 2 ]PGV[cm/s] Damage Situation within 200mNumber ofBuildingsDamageRatio [%]REHS 6.20 6.19 723.0 97.7 Many buildings were heavy damaged. 98 15.3HVSC 6.42 5.66 1860.0 100.4 Destruction of roofing tiles and exterior materials. 21 9.1 ‡Some masonry buildings were broken.PRPC 6.10 6.00 737.0 124.2 Many buildings were damaged at roofing tiles. 90 0LPCC 5.77 5.01 1070.2 48.0 The ground damage of cliff. 17 5.9 §CCCC 5.98 6.04 472.5 68.2 Some buildings were heavy damaged. 23 8.7 ||HPSC 5.52 5.31 324.9 49.9 Destruction of exterior materials Liquefaction. 68 0SHLC 5.76 5.59 363.6 77.1 Crack of RC structure’s pillars.113 0Liquefaction.CHHC 5.79 5.75 460.0 82.7 — — —CMHS 5.77 5.65 415.3 50.2 — — —CBGS 5.83 5.71 653.3 73.5 — — —* I j : JMA seismic intensity† I 1–2 : Seismic intensity based on elastic responses between 1 and 2 second period‡ It is the reference values because the building was few.§ It is the reference values because the damageed building was on the cliff.|| It is the reference values because the seismic station position was uncertain.Seismological Research Letters Volume 82, Number 6 November/December 2011 877


