

Here - Stuff
Here - Stuff
Here - Stuff

You also want an ePaper? Increase the reach of your titles
YUMPU automatically turns print PDFs into web optimized ePapers that Google loves.
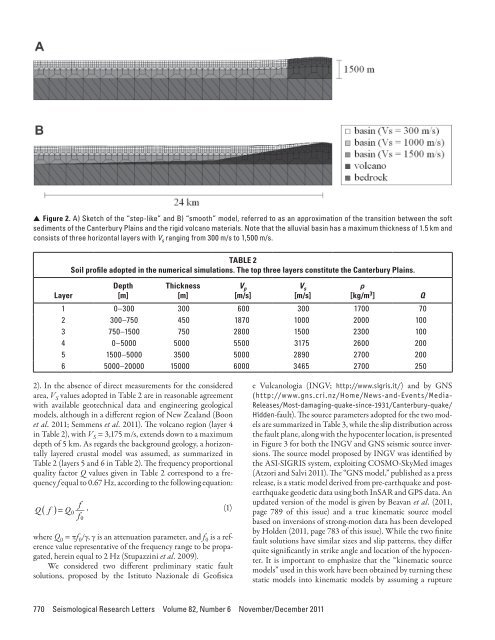
▲▲Figure 2. A) Sketch of the “step-like” and B) “smooth” model, referred to as an approximation of the transition between the softsediments of the Canterbury Plains and the rigid volcano materials. Note that the alluvial basin has a maximum thickness of 1.5 km andconsists of three horizontal layers with V s ranging from 300 m/s to 1,500 m/s.LayerTABLE 2Soil profile adopted in the numerical simulations. The top three layers constitute the Canterbury Plains.Depth[m]Thickness[m]V p[m/s]V s[m/s]ρ[kg/m 3 ]1 0–300 300 600 300 1700 702 300–750 450 1870 1000 2000 1003 750–1500 750 2800 1500 2300 1004 0–5000 5000 5500 3175 2600 2005 1500–5000 3500 5000 2890 2700 2006 5000–20000 15000 6000 3465 2700 250Q2). In the absence of direct measurements for the consideredarea, V S values adopted in Table 2 are in reasonable agreementwith available geotechnical data and engineering geologicalmodels, although in a different region of New Zealand (Boonet al. 2011; Semmens et al. 2011). The volcano region (layer 4in Table 2), with V S = 3,175 m/s, extends down to a maximumdepth of 5 km. As regards the background geology, a horizontallylayered crustal model was assumed, as summarized inTable 2 (layers 5 and 6 in Table 2). The frequency proportionalquality factor Q values given in Table 2 correspond to a frequencyf equal to 0.67 Hz, according to the following equation:fQ ( f ) = Q 0, (1)f 0where Q 0 = πf 0 /γ, γ is an attenuation parameter, and f 0 is a referencevalue representative of the frequency range to be propagated,herein equal to 2 Hz (Stupazzini et al. 2009).We considered two different preliminary static faultsolutions, proposed by the Istituto Nazionale di Geofisicae Vulcanologia (INGV; http://www.sigris.it/) and by GNS(http://www.gns.cri.nz/Home/News-and-Events/Media-Releases/Most-damaging-quake-since-1931/Canterbury-quake/Hidden-fault). The source parameters adopted for the two modelsare summarized in Table 3, while the slip distribution acrossthe fault plane, along with the hypocenter location, is presentedin Figure 3 for both the INGV and GNS seismic source inversions.The source model proposed by INGV was identified bythe ASI-SIGRIS system, exploiting COSMO-SkyMed images(Atzori and Salvi 2011). The “GNS model,” published as a pressrelease, is a static model derived from pre-earthquake and postearthquakegeodetic data using both InSAR and GPS data. Anupdated version of the model is given by Beavan et al. (2011,page 789 of this issue) and a true kinematic source modelbased on inversions of strong-motion data has been developedby Holden (2011, page 783 of this issue). While the two finitefault solutions have similar sizes and slip patterns, they differquite significantly in strike angle and location of the hypocenter.It is important to emphasize that the “kinematic sourcemodels” used in this work have been obtained by turning thesestatic models into kinematic models by assuming a rupture770 Seismological Research Letters Volume 82, Number 6 November/December 2011


