

Here - Stuff
Here - Stuff
Here - Stuff

You also want an ePaper? Increase the reach of your titles
YUMPU automatically turns print PDFs into web optimized ePapers that Google loves.
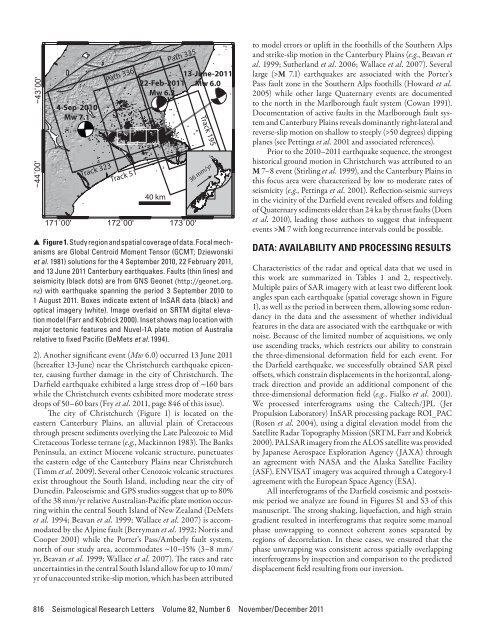
−44˚00' −43˚00'4-Sep-2010Mw 7.1Track 323Path 336NTrack 5113-June-201122-Feb-2011 Mw 6.0Mw 6.340 kmPath 335171˚00' 172˚00' 173˚00'Track 19536 mm/yr▲ ▲ Figure 1. Study region and spatial coverage of data. Focal mechanismsare Global Centroid Moment Tensor (GCMT; Dziewonskiet al. 1981) solutions for the 4 September 2010, 22 February 2011,and 13 June 2011 Canterbury earthquakes. Faults (thin lines) andseismicity (black dots) are from GNS Geonet (http://geonet.org.nz) with earthquake spanning the period 3 September 2010 to1 August 2011. Boxes indicate extent of InSAR data (black) andoptical imagery (white). Image overlaid on SRTM digital elevationmodel (Farr and Kobrick 2000). Inset shows map location withmajor tectonic features and Nuvel-1A plate motion of Australiarelative to fixed Pacific (DeMets et al. 1994).2). Another significant event (Mw 6.0) occurred 13 June 2011(hereafter 13-June) near the Christchurch earthquake epicenter,causing further damage in the city of Christchurch. TheDarfield earthquake exhibited a large stress drop of ~160 barswhile the Christchurch events exhibited more moderate stressdrops of 50–60 bars (Fry et al. 2011, page 846 of this issue).The city of Christchurch (Figure 1) is located on theeastern Canterbury Plains, an alluvial plain of Cretaceousthrough present sediments overlying the Late Paleozoic to MidCretaceous Torlesse terrane (e.g., Mackinnon 1983). The BanksPeninsula, an extinct Miocene volcanic structure, punctuatesthe eastern edge of the Canterbury Plains near Christchurch(Timm et al. 2009). Several other Cenozoic volcanic structuresexist throughout the South Island, including near the city ofDunedin. Paleoseismic and GPS studies suggest that up to 80%of the 38 mm/yr relative Australian-Pacific plate motion occurringwithin the central South Island of New Zealand (DeMetset al. 1994; Beavan et al. 1999; Wallace et al. 2007) is accommodatedby the Alpine fault (Berryman et al. 1992; Norris andCooper 2001) while the Porter’s Pass/Amberly fault system,north of our study area, accommodates ~10–15% (3–8 mm/yr, Beavan et al. 1999; Wallace et al. 2007). The rates and rateuncertainties in the central South Island allow for up to 10 mm/yr of unaccounted strike-slip motion, which has been attributedto model errors or uplift in the foothills of the Southern Alpsand strike-slip motion in the Canterbury Plains (e.g., Beavan etal. 1999; Sutherland et al. 2006; Wallace et al. 2007). Severallarge (>M 7.1) earthquakes are associated with the Porter’sPass fault zone in the Southern Alps foothills (Howard et al.2005) while other large Quaternary events are documentedto the north in the Marlborough fault system (Cowan 1991).Documentation of active faults in the Marlborough fault systemand Canterbury Plains reveals dominantly right-lateral andreverse-slip motion on shallow to steeply (>50 degrees) dippingplanes (see Pettinga et al. 2001 and associated references).Prior to the 2010–2011 earthquake sequence, the strongesthistorical ground motion in Christchurch was attributed to anM 7–8 event (Stirling et al. 1999), and the Canterbury Plains inthis focus area were characterized by low to moderate rates ofseismicity (e.g., Pettinga et al. 2001). Reflection-seismic surveysin the vicinity of the Darfield event revealed offsets and foldingof Quaternary sediments older than 24 ka by thrust faults (Dornet al. 2010), leading those authors to suggest that infrequentevents >M 7 with long recurrence intervals could be possible.DATA: AVAILABILITY AND PROCESSING RESULTSCharacteristics of the radar and optical data that we used inthis work are summarized in Tables 1 and 2, respectively.Multiple pairs of SAR imagery with at least two different lookangles span each earthquake (spatial coverage shown in Figure1), as well as the period in between them, allowing some redundancyin the data and the assessment of whether individualfeatures in the data are associated with the earthquake or withnoise. Because of the limited number of acquisitions, we onlyuse ascending tracks, which restricts our ability to constrainthe three-dimensional deformation field for each event. Forthe Darfield earthquake, we successfully obtained SAR pixeloffsets, which constrain displacements in the horizontal, alongtrackdirection and provide an additional component of thethree-dimensional deformation field (e.g., Fialko et al. 2001).We processed interferograms using the Caltech/JPL (JetPropulsion Laboratory) InSAR processing package ROI_PAC(Rosen et al. 2004), using a digital elevation model from theSatellite Radar Topography Mission (SRTM, Farr and Kobrick2000). PALSAR imagery from the ALOS satellite was providedby Japanese Aerospace Exploration Agency (JAXA) throughan agreement with NASA and the Alaska Satellite Facility(ASF). ENVISAT imagery was acquired through a Category-1agreement with the European Space Agency (ESA).All interferograms of the Darfield coseismic and postseismicperiod we analyze are found in Figures S1 and S3 of thismanuscript. The strong shaking, liquefaction, and high straingradient resulted in interferograms that require some manualphase unwrapping to connect coherent zones separated byregions of decorrelation. In these cases, we ensured that thephase unwrapping was consistent across spatially overlappinginterferograms by inspection and comparison to the predicteddisplacement field resulting from our inversion.816 Seismological Research Letters Volume 82, Number 6 November/December 2011


