

Here - Stuff
Here - Stuff
Here - Stuff

Create successful ePaper yourself
Turn your PDF publications into a flip-book with our unique Google optimized e-Paper software.
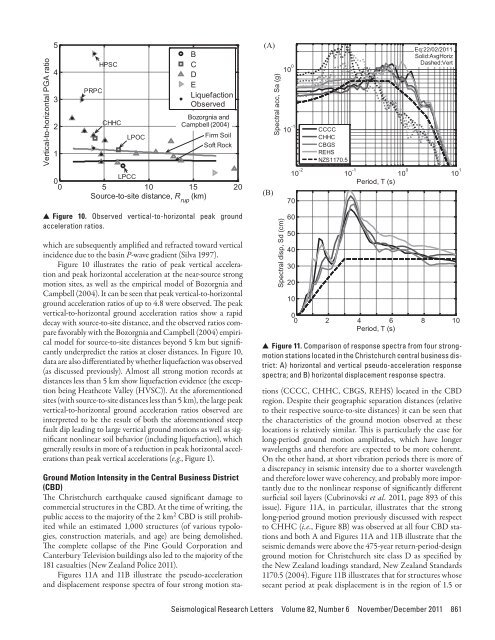
Vertical-to-horizontal PGA ratio54321PRPCHPSCCHHCLPOCBCDELiquefactionObservedBozorgnia andCampbell (2004)Firm SoilSoft RockLPCC00 5 10 15 20Source-to-site distance, R rup(km)▲▲Figure 10. Observed vertical-to-horizontal peak groundacceleration ratios.which are subsequently amplified and refracted toward verticalincidence due to the basin P-wave gradient (Silva 1997).Figure 10 illustrates the ratio of peak vertical accelerationand peak horizontal acceleration at the near-source strongmotion sites, as well as the empirical model of Bozorgnia andCampbell (2004). It can be seen that peak vertical-to-horizontalground acceleration ratios of up to 4.8 were observed. The peakvertical-to-horizontal ground acceleration ratios show a rapiddecay with source-to-site distance, and the observed ratios comparefavorably with the Bozorgnia and Campbell (2004) empiricalmodel for source-to-site distances beyond 5 km but significantlyunderpredict the ratios at closer distances. In Figure 10,data are also differentiated by whether liquefaction was observed(as discussed previously). Almost all strong motion records atdistances less than 5 km show liquefaction evidence (the exceptionbeing Heathcote Valley (HVSC)). At the aforementionedsites (with source-to-site distances less than 5 km), the large peakvertical-to-horizontal ground acceleration ratios observed areinterpreted to be the result of both the aforementioned steepfault dip leading to large vertical ground motions as well as significantnonlinear soil behavior (including liquefaction), whichgenerally results in more of a reduction in peak horizontal accelerationsthan peak vertical accelerations (e.g., Figure 1).(A)(B)Spectral acc, Sa (g)Spectral disp, Sd (cm)Eq:22/02/2011Solid:AvgHorizDashed:Vert10 -1 CCCCCHHCCBGSREHSNZS1170.510 -2 10 -1 10 0 10 110 0 Period, T (s)7060504030201000 2 4 6 8 10Period, T (s)▲ ▲ Figure 11. Comparison of response spectra from four strongmotionstations located in the Christchurch central business district:A) horizontal and vertical pseudo-acceleration responsespectra; and B) horizontal displacement response spectra.Ground Motion Intensity in the Central Business District(CBD)The Christchurch earthquake caused significant damage tocommercial structures in the CBD. At the time of writing, thepublic access to the majority of the 2 km 2 CBD is still prohibitedwhile an estimated 1,000 structures (of various typologies,construction materials, and age) are being demolished.The complete collapse of the Pine Gould Corporation andCanterbury Television buildings also led to the majority of the181 casualties (New Zealand Police 2011).Figures 11A and 11B illustrate the pseudo-accelerationand displacement response spectra of four strong motion stations(CCCC, CHHC, CBGS, REHS) located in the CBDregion. Despite their geographic separation distances (relativeto their respective source-to-site distances) it can be seen thatthe characteristics of the ground motion observed at theselocations is relatively similar. This is particularly the case forlong-period ground motion amplitudes, which have longerwavelengths and therefore are expected to be more coherent.On the other hand, at short vibration periods there is more ofa discrepancy in seismic intensity due to a shorter wavelengthand therefore lower wave coherency, and probably more importantlydue to the nonlinear response of significantly differentsurficial soil layers (Cubrinovski et al. 2011, page 893 of thisissue). Figure 11A, in particular, illustrates that the stronglong-period ground motion previously discussed with respectto CHHC (i.e., Figure 8B) was observed at all four CBD stationsand both A and Figures 11A and 11B illustrate that theseismic demands were above the 475-year return-period-designground motion for Christchurch site class D as specified bythe New Zealand loadings standard, New Zealand Standards1170.5 (2004). Figure 11B illustrates that for structures whosesecant period at peak displacement is in the region of 1.5 orSeismological Research Letters Volume 82, Number 6 November/December 2011 861


