

Here - Stuff
Here - Stuff
Here - Stuff

You also want an ePaper? Increase the reach of your titles
YUMPU automatically turns print PDFs into web optimized ePapers that Google loves.
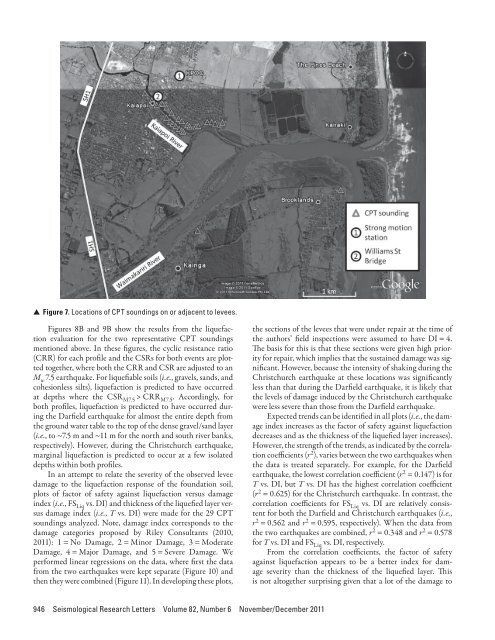
▲▲Figure 7. Locations of CPT soundings on or adjacent to levees.Figures 8B and 9B show the results from the liquefactionevaluation for the two representative CPT soundingsmentioned above. In these figures, the cyclic resistance ratio(CRR) for each profile and the CSRs for both events are plottedtogether, where both the CRR and CSR are adjusted to anM w 7.5 earthquake. For liquefiable soils (i.e., gravels, sands, andcohesionless silts), liquefaction is predicted to have occurredat depths where the CSR M7.5 > CRR M7.5 . Accordingly, forboth profiles, liquefaction is predicted to have occurred duringthe Darfield earthquake for almost the entire depth fromthe ground water table to the top of the dense gravel/sand layer(i.e., to ~7.5 m and ~11 m for the north and south river banks,respectively). However, during the Christchurch earthquake,marginal liquefaction is predicted to occur at a few isolateddepths within both profiles.In an attempt to relate the severity of the observed leveedamage to the liquefaction response of the foundation soil,plots of factor of safety against liquefaction versus damageindex (i.e., FS Liq vs. DI) and thickness of the liquefied layer versusdamage index (i.e., T vs. DI) were made for the 29 CPTsoundings analyzed. Note, damage index corresponds to thedamage categories proposed by Riley Consultants (2010,2011): 1 = No Damage, 2 = Minor Damage, 3 = ModerateDamage, 4 = Major Damage, and 5 = Severe Damage. Weperformed linear regressions on the data, where first the datafrom the two earthquakes were kept separate (Figure 10) andthen they were combined (Figure 11). In developing these plots,the sections of the levees that were under repair at the time ofthe authors’ field inspections were assumed to have DI = 4.The basis for this is that these sections were given high priorityfor repair, which implies that the sustained damage was significant.However, because the intensity of shaking during theChristchurch earthquake at these locations was significantlyless than that during the Darfield earthquake, it is likely thatthe levels of damage induced by the Christchurch earthquakewere less severe than those from the Darfield earthquake.Expected trends can be identified in all plots (i.e., the damageindex increases as the factor of safety against liquefactiondecreases and as the thickness of the liquefied layer increases).However, the strength of the trends, as indicated by the correlationcoefficients (r 2 ), varies between the two earthquakes whenthe data is treated separately. For example, for the Darfieldearthquake, the lowest correlation coefficient (r 2 = 0.147) is forT vs. DI, but T vs. DI has the highest correlation coefficient(r 2 = 0.625) for the Christchurch earthquake. In contrast, thecorrelation coefficients for FS Liq vs. DI are relatively consistentfor both the Darfield and Christchurch earthquakes (i.e.,r 2 = 0.562 and r 2 = 0.595, respectively). When the data fromthe two earthquakes are combined, r 2 = 0.348 and r 2 = 0.578for T vs. DI and FS Liq vs. DI, respectively.From the correlation coefficients, the factor of safetyagainst liquefaction appears to be a better index for damageseverity than the thickness of the liquefied layer. Thisis not altogether surprising given that a lot of the damage to946 Seismological Research Letters Volume 82, Number 6 November/December 2011


