

Here - Stuff
Here - Stuff
Here - Stuff

Create successful ePaper yourself
Turn your PDF publications into a flip-book with our unique Google optimized e-Paper software.
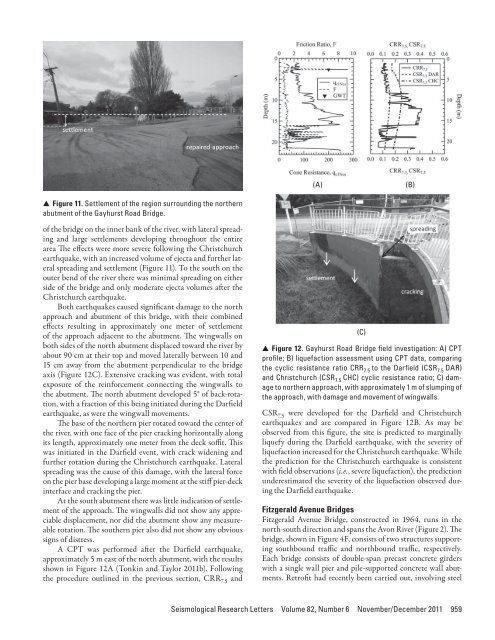
(A)(B)▲▲Figure 11. Settlement of the region surrounding the northernabutment of the Gayhurst Road Bridge.of the bridge on the inner bank of the river, with lateral spreadingand large settlements developing throughout the entirearea The effects were more severe following the Christchurchearthquake, with an increased volume of ejecta and further lateralspreading and settlement (Figure 11). To the south on theouter bend of the river there was minimal spreading on eitherside of the bridge and only moderate ejecta volumes after theChristchurch earthquake.Both earthquakes caused significant damage to the northapproach and abutment of this bridge, with their combinedeffects resulting in approximately one meter of settlementof the approach adjacent to the abutment. The wingwalls onboth sides of the north abutment displaced toward the river byabout 90 cm at their top and moved laterally between 10 and15 cm away from the abutment perpendicular to the bridgeaxis (Figure 12C). Extensive cracking was evident, with totalexposure of the reinforcement connecting the wingwalls tothe abutment. The north abutment developed 5° of back-rotation,with a fraction of this being initiated during the Darfieldearthquake, as were the wingwall movements.The base of the northern pier rotated toward the center ofthe river, with one face of the pier cracking horizontally alongits length, approximately one meter from the deck soffit. Thiswas initiated in the Darfield event, with crack widening andfurther rotation during the Christchurch earthquake. Lateralspreading was the cause of this damage, with the lateral forceon the pier base developing a large moment at the stiff pier-deckinterface and cracking the pier.At the south abutment there was little indication of settlementof the approach. The wingwalls did not show any appreciabledisplacement, nor did the abutment show any measureablerotation. The southern pier also did not show any obvioussigns of distress.A CPT was performed after the Darfield earthquake,approximately 5 m east of the north abutment, with the resultsshown in Figure 12A (Tonkin and Taylor 2011b). Followingthe procedure outlined in the previous section, CRR 7.5 and(C)▲▲Figure 12. Gayhurst Road Bridge field investigation: A) CPTprofile; B) liquefaction assessment using CPT data, comparingthe cyclic resistance ratio CRR 7.5 to the Darfield (CSR 7.5 DAR)and Christchurch (CSR 7.5 CHC) cyclic resistance ratio; C) damageto northern approach, with approximately 1 m of slumping ofthe approach, with damage and movement of wingwalls.CSR 7.5 were developed for the Darfield and Christchurchearthquakes and are compared in Figure 12B. As may beobserved from this figure, the site is predicted to marginallyliquefy during the Darfield earthquake, with the severity ofliquefaction increased for the Christchurch earthquake. Whilethe prediction for the Christchurch earthquake is consistentwith field observations (i.e., severe liquefaction), the predictionunderestimated the severity of the liquefaction observed duringthe Darfield earthquake.Fitzgerald Avenue BridgesFitzgerald Avenue Bridge, constructed in 1964, runs in thenorth-south direction and spans the Avon River (Figure 2). Thebridge, shown in Figure 4F, consists of two structures supportingsouthbound traffic and northbound traffic, respectively.Each bridge consists of double-span precast concrete girderswith a single wall pier and pile-supported concrete wall abutments.Retrofit had recently been carried out, involving steelSeismological Research Letters Volume 82, Number 6 November/December 2011 959


