

Here - Stuff
Here - Stuff
Here - Stuff

Create successful ePaper yourself
Turn your PDF publications into a flip-book with our unique Google optimized e-Paper software.
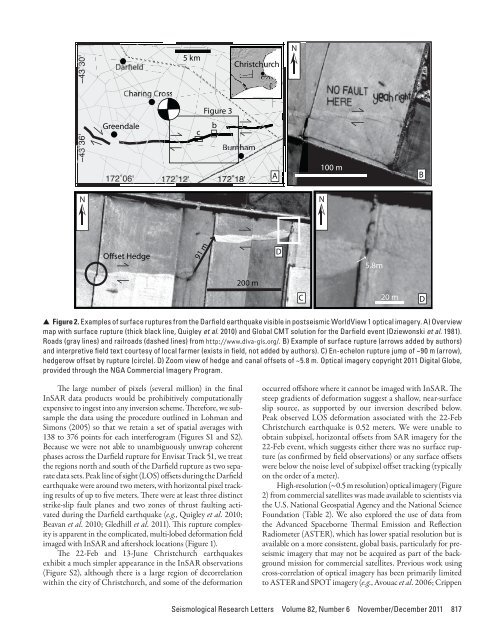
−43˚36' −43˚30'Greendale172˚06'5 kmChristchurchFigure 3bcAN100 mBNN91 mD5.8m200 mC20 m D▲ ▲ Figure 2. Examples of surface ruptures from the Darfield earthquake visible in postseismic WorldView 1 optical imagery. A) Overviewmap with surface rupture (thick black line, Quigley et al. 2010) and Global CMT solution for the Darfield event (Dziewonski et al. 1981).Roads (gray lines) and railroads (dashed lines) from http://www.diva-gis.org/. B) Example of surface rupture (arrows added by authors)and interpretive field text courtesy of local farmer (exists in field, not added by authors). C) En-echelon rupture jump of ~90 m (arrow),hedgerow offset by rupture (circle). D) Zoom view of hedge and canal offsets of ~5.8 m. Optical imagery copyright 2011 Digital Globe,provided through the NGA Commercial Imagery Program.The large number of pixels (several million) in the finalInSAR data products would be prohibitively computationallyexpensive to ingest into any inversion scheme. Therefore, we subsamplethe data using the procedure outlined in Lohman andSimons (2005) so that we retain a set of spatial averages with138 to 376 points for each interferogram (Figures S1 and S2).Because we were not able to unambiguously unwrap coherentphases across the Darfield rupture for Envisat Track 51, we treatthe regions north and south of the Darfield rupture as two separatedata sets. Peak line of sight (LOS) offsets during the Darfieldearthquake were around two meters, with horizontal pixel trackingresults of up to five meters. There were at least three distinctstrike-slip fault planes and two zones of thrust faulting activatedduring the Darfield earthquake (e.g., Quigley et al. 2010;Beavan et al. 2010; Gledhill et al. 2011). This rupture complexityis apparent in the complicated, multi-lobed deformation fieldimaged with InSAR and aftershock locations (Figure 1).The 22-Feb and 13-June Christchurch earthquakesexhibit a much simpler appearance in the InSAR observations(Figure S2), although there is a large region of decorrelationwithin the city of Christchurch, and some of the deformationoccurred offshore where it cannot be imaged with InSAR. Thesteep gradients of deformation suggest a shallow, near-surfaceslip source, as supported by our inversion described below.Peak observed LOS deformation associated with the 22-FebChristchurch earthquake is 0.52 meters. We were unable toobtain subpixel, horizontal offsets from SAR imagery for the22-Feb event, which suggests either there was no surface rupture(as confirmed by field observations) or any surface offsetswere below the noise level of subpixel offset tracking (typicallyon the order of a meter).High-resolution (~0.5 m resolution) optical imagery (Figure2) from commercial satellites was made available to scientists viathe U.S. National Geospatial Agency and the National ScienceFoundation (Table 2). We also explored the use of data fromthe Advanced Spaceborne Thermal Emission and ReflectionRadiometer (ASTER), which has lower spatial resolution but isavailable on a more consistent, global basis, particularly for preseismicimagery that may not be acquired as part of the backgroundmission for commercial satellites. Previous work usingcross-correlation of optical imagery has been primarily limitedto ASTER and SPOT imagery (e.g., Avouac et al. 2006; CrippenSeismological Research Letters Volume 82, Number 6 November/December 2011 817


