

Here - Stuff
Here - Stuff
Here - Stuff

You also want an ePaper? Increase the reach of your titles
YUMPU automatically turns print PDFs into web optimized ePapers that Google loves.
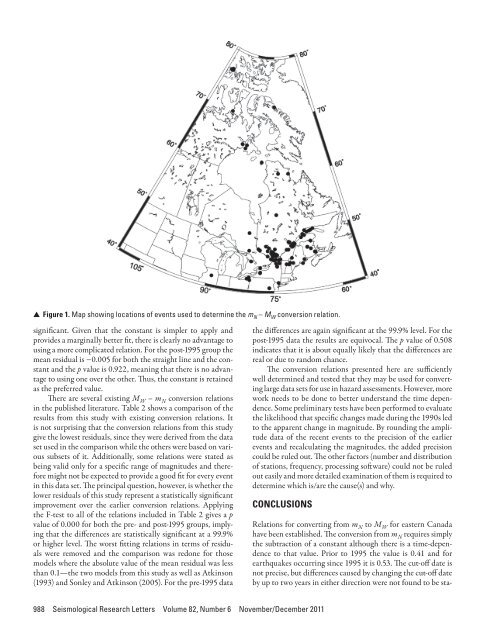
▲▲Figure 1. Map showing locations of events used to determine the m N – M W conversion relation.significant. Given that the constant is simpler to apply andprovides a marginally better fit, there is clearly no advantage tousing a more complicated relation. For the post-1995 group themean residual is −0.005 for both the straight line and the constantand the p value is 0.922, meaning that there is no advantageto using one over the other. Thus, the constant is retainedas the preferred value.There are several existing M W – m N conversion relationsin the published literature. Table 2 shows a comparison of theresults from this study with existing conversion relations. Itis not surprising that the conversion relations from this studygive the lowest residuals, since they were derived from the dataset used in the comparison while the others were based on varioussubsets of it. Additionally, some relations were stated asbeing valid only for a specific range of magnitudes and thereforemight not be expected to provide a good fit for every eventin this data set. The principal question, however, is whether thelower residuals of this study represent a statistically significantimprovement over the earlier conversion relations. Applyingthe F-test to all of the relations included in Table 2 gives a pvalue of 0.000 for both the pre- and post-1995 groups, implyingthat the differences are statistically significant at a 99.9%or higher level. The worst fitting relations in terms of residualswere removed and the comparison was redone for thosemodels where the absolute value of the mean residual was lessthan 0.1—the two models from this study as well as Atkinson(1993) and Sonley and Atkinson (2005). For the pre-1995 datathe differences are again significant at the 99.9% level. For thepost-1995 data the results are equivocal. The p value of 0.508indicates that it is about equally likely that the differences arereal or due to random chance.The conversion relations presented here are sufficientlywell determined and tested that they may be used for convertinglarge data sets for use in hazard assessments. However, morework needs to be done to better understand the time dependence.Some preliminary tests have been performed to evaluatethe likelihood that specific changes made during the 1990s ledto the apparent change in magnitude. By rounding the amplitudedata of the recent events to the precision of the earlierevents and recalculating the magnitudes, the added precisioncould be ruled out. The other factors (number and distributionof stations, frequency, processing software) could not be ruledout easily and more detailed examination of them is required todetermine which is/are the cause(s) and why.CONCLUSIONSRelations for converting from m N to M W for eastern Canadahave been established. The conversion from m N requires simplythe subtraction of a constant although there is a time-dependenceto that value. Prior to 1995 the value is 0.41 and forearthquakes occurring since 1995 it is 0.53. The cut-off date isnot precise, but differences caused by changing the cut-off dateby up to two years in either direction were not found to be sta-988 Seismological Research Letters Volume 82, Number 6 November/December 2011


