

Here - Stuff
Here - Stuff
Here - Stuff

Create successful ePaper yourself
Turn your PDF publications into a flip-book with our unique Google optimized e-Paper software.
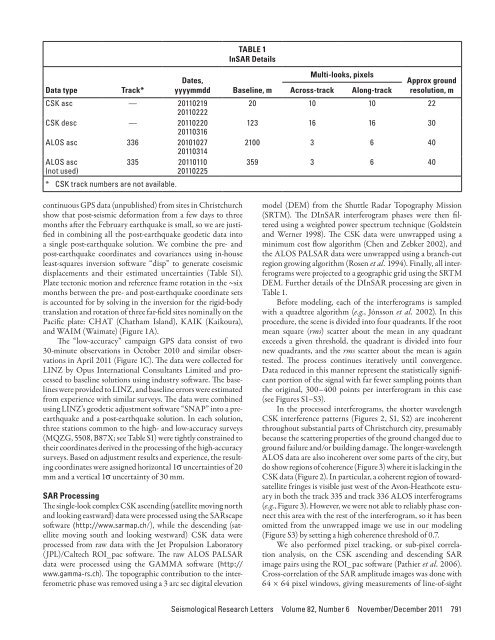
TABLE 1InSAR DetailsData typeTrack*Dates,yyyymmddCSK asc — 2011021920110222CSK desc — 2011022020110316ALOS asc 336 2010102720110314ALOS asc335 20110110(not used)20110225* CSK track numbers are not available.Multi-looks, pixelsApprox groundBaseline, m Across-track Along-track resolution, m20 10 10 22123 16 16 302100 3 6 40359 3 6 40continuous GPS data (unpublished) from sites in Christchurchshow that post-seismic deformation from a few days to threemonths after the February earthquake is small, so we are justifiedin combining all the post-earthquake geodetic data intoa single post-earthquake solution. We combine the pre- andpost-earthquake coordinates and covariances using in-houseleast-squares inversion software “disp” to generate coseismicdisplacements and their estimated uncertainties (Table S1).Plate tectonic motion and reference frame rotation in the ~sixmonths between the pre- and post-earthquake coordinate setsis accounted for by solving in the inversion for the rigid-bodytranslation and rotation of three far-field sites nominally on thePacific plate: CHAT (Chatham Island), KAIK (Kaikoura),and WAIM (Waimate) (Figure 1A).The “low-accuracy” campaign GPS data consist of two30-minute observations in October 2010 and similar observationsin April 2011 (Figure 1C). The data were collected forLINZ by Opus International Consultants Limited and processedto baseline solutions using industry software. The baselineswere provided to LINZ, and baseline errors were estimatedfrom experience with similar surveys. The data were combinedusing LINZ’s geodetic adjustment software “SNAP” into a preearthquakeand a post-earthquake solution. In each solution,three stations common to the high- and low-accuracy surveys(MQZG, 5508, B87X; see Table S1) were tightly constrained totheir coordinates derived in the processing of the high-accuracysurveys. Based on adjustment results and experience, the resultingcoordinates were assigned horizontal 1s uncertainties of 20mm and a vertical 1s uncertainty of 30 mm.SAR ProcessingThe single-look complex CSK ascending (satellite moving northand looking eastward) data were processed using the SARscapesoftware (http://www.sarmap.ch/), while the descending (satellitemoving south and looking westward) CSK data wereprocessed from raw data with the Jet Propulsion Laboratory(JPL)/Caltech ROI_pac software. The raw ALOS PALSARdata were processed using the GAMMA software (http://www.gamma-rs.ch). The topographic contribution to the interferometricphase was removed using a 3 arc sec digital elevationmodel (DEM) from the Shuttle Radar Topography Mission(SRTM). The DInSAR interferogram phases were then filteredusing a weighted power spectrum technique (Goldsteinand Werner 1998). The CSK data were unwrapped using aminimum cost flow algorithm (Chen and Zebker 2002), andthe ALOS PALSAR data were unwrapped using a branch-cutregion growing algorithm (Rosen et al. 1994). Finally, all interferogramswere projected to a geographic grid using the SRTMDEM. Further details of the DInSAR processing are given inTable 1.Before modeling, each of the interferograms is sampledwith a quadtree algorithm (e.g., Jónsson et al. 2002). In thisprocedure, the scene is divided into four quadrants. If the rootmean square (rms) scatter about the mean in any quadrantexceeds a given threshold, the quadrant is divided into fournew quadrants, and the rms scatter about the mean is againtested. The process continues iteratively until convergence.Data reduced in this manner represent the statistically significantportion of the signal with far fewer sampling points thanthe original, 300–400 points per interferogram in this case(see Figures S1–S3).In the processed interferograms, the shorter wavelengthCSK interference patterns (Figures 2, S1, S2) are incoherentthroughout substantial parts of Christchurch city, presumablybecause the scattering properties of the ground changed due toground failure and/or building damage. The longer-wavelengthALOS data are also incoherent over some parts of the city, butdo show regions of coherence (Figure 3) where it is lacking in theCSK data (Figure 2). In particular, a coherent region of towardsatellitefringes is visible just west of the Avon-Heathcote estuaryin both the track 335 and track 336 ALOS interferograms(e.g., Figure 3). However, we were not able to reliably phase connectthis area with the rest of the interferogram, so it has beenomitted from the unwrapped image we use in our modeling(Figure S3) by setting a high coherence threshold of 0.7.We also performed pixel tracking, or sub-pixel correlationanalysis, on the CSK ascending and descending SARimage pairs using the ROI_pac software (Pathier et al. 2006).Cross-correlation of the SAR amplitude images was done with64 × 64 pixel windows, giving measurements of line-of-sightSeismological Research Letters Volume 82, Number 6 November/December 2011 791


