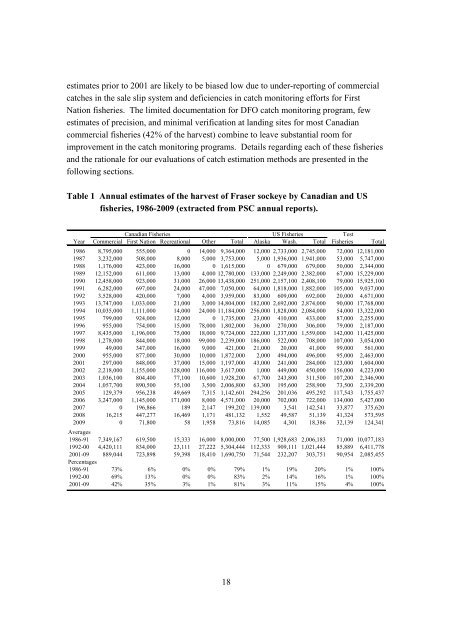
FISHERIES HARVESTINGOverview of <strong>Fisheries</strong><strong>Fraser</strong> sockeye are harvested at numerous points along their return migration pathbetween Alaska <strong>and</strong> spawning areas in the upper <strong>Fraser</strong> watershed (Figure 1, Figure 2).Given the diversity of <strong>Fraser</strong> sockeye stocks, virtually all of the harvests are classified as“mixed-stock” fisheries.Table 1 provides the annual estimates of the number of <strong>Fraser</strong> sockeye harvested by eachof the three major fishing sectors in Canada (First Nations, commercial, <strong>and</strong> recreational)<strong>and</strong> two distinct fishing areas in the US (Washington <strong>and</strong> Alaska). These catch estimateswere extracted from PSC annual reports because these reports are the only publishedsource of catch estimates for <strong>Fraser</strong> sockeye. Table 2 provides a summary of ourqualitative ratings for accuracy, precision, <strong>and</strong> reliability of the data used to generate thecatch estimates for the majority of the sockeye harvested in each fishery. For example, ifcatch estimates for seines were rated “Good” <strong>and</strong> seines catch the majority of thesockeye, the overall rating will be “Good” for that fishery. A quantitative assessment ofaccuracy was not possible because the true catch values are not known. Similarly, therewas insufficient information to quantitatively assess the precision of catch estimates. ForTable 2 <strong>and</strong> other similar summary tables in the report, we used the following qualitativeratingscales for our evaluations of data quality:Accuracy = the degree managers can be confident that the reported catch reflectsthe actual harvest (“Fair” = likely biased low in some or most years; “Good” =any bias is likely to be small; “Very Good” = complete enumeration of the catch).Precision = generally unknown for most fisheries, estimates of precision areprovided where available <strong>and</strong> where catch estimates are a complete count, theprecision rating was “High”).Reliability = the degree managers can rely on the catch estimates for in-season<strong>and</strong> post-season assessments. These ratings are similar to the ratings for accuracyexcept biased estimates that received a “Fair” rating for accuracy could receive a“Medium” rating for reliability if the direction of the bias is known.Since 2001, the overall ratings for <strong>Fraser</strong> sockeye catch estimates were: “Good” foraccuracy, “Unknown” for precision, <strong>and</strong> “Medium” for reliability (Table 2). The catch17
estimates prior to 2001 are likely to be biased low due to under-reporting of commercialcatches in the sale slip system <strong>and</strong> deficiencies in catch monitoring efforts for FirstNation fisheries. The limited documentation for DFO catch monitoring program, fewestimates of precision, <strong>and</strong> minimal verification at l<strong>and</strong>ing sites for most Canadiancommercial fisheries (42% of the harvest) combine to leave substantial room forimprovement in the catch monitoring programs. Details regarding each of these fisheries<strong>and</strong> the rationale for our evaluations of catch estimation methods are presented in thefollowing sections.Table 1 Annual estimates of the harvest of <strong>Fraser</strong> sockeye by Canadian <strong>and</strong> USfisheries, 1986-2009 (extracted from PSC annual reports).Canadian <strong>Fisheries</strong> US <strong>Fisheries</strong> TestYear Commercial First Nation Recreational Other Total Alaska Wash. Total <strong>Fisheries</strong> Total1986 8,795,000 555,000 0 14,000 9,364,000 12,000 2,733,000 2,745,000 72,000 12,181,0001987 3,232,000 508,000 8,000 5,000 3,753,000 5,000 1,936,000 1,941,000 53,000 5,747,0001988 1,176,000 423,000 16,000 0 1,615,000 0 679,000 679,000 50,000 2,344,0001989 12,152,000 611,000 13,000 4,000 12,780,000 133,000 2,249,000 2,382,000 67,000 15,229,0001990 12,458,000 923,000 31,000 26,000 13,438,000 251,000 2,157,100 2,408,100 79,000 15,925,1001991 6,282,000 697,000 24,000 47,000 7,050,000 64,000 1,818,000 1,882,000 105,000 9,037,0001992 3,528,000 420,000 7,000 4,000 3,959,000 83,000 609,000 692,000 20,000 4,671,0001993 13,747,000 1,033,000 21,000 3,000 14,804,000 182,000 2,692,000 2,874,000 90,000 17,768,0001994 10,035,000 1,111,000 14,000 24,000 11,184,000 256,000 1,828,000 2,084,000 54,000 13,322,0001995 799,000 924,000 12,000 0 1,735,000 23,000 410,000 433,000 87,000 2,255,0001996 955,000 754,000 15,000 78,000 1,802,000 36,000 270,000 306,000 79,000 2,187,0001997 8,435,000 1,196,000 75,000 18,000 9,724,000 222,000 1,337,000 1,559,000 142,000 11,425,0001998 1,278,000 844,000 18,000 99,000 2,239,000 186,000 522,000 708,000 107,000 3,054,0001999 49,000 347,000 16,000 9,000 421,000 21,000 20,000 41,000 99,000 561,0002000 955,000 877,000 30,000 10,000 1,872,000 2,000 494,000 496,000 95,000 2,463,0002001 297,000 848,000 37,000 15,000 1,197,000 43,000 241,000 284,000 123,000 1,604,0002002 2,218,000 1,155,000 128,000 116,000 3,617,000 1,000 449,000 450,000 156,000 4,223,0002003 1,036,100 804,400 77,100 10,600 1,928,200 67,700 243,800 311,500 107,200 2,346,9002004 1,057,700 890,500 55,100 3,500 2,006,800 63,300 195,600 258,900 73,500 2,339,2002005 129,379 956,238 49,669 7,315 1,142,601 294,256 201,036 495,292 117,543 1,755,4372006 3,247,000 1,145,000 171,000 8,000 4,571,000 20,000 702,000 722,000 134,000 5,427,0002007 0 196,866 189 2,147 199,202 139,000 3,541 142,541 33,877 375,6202008 16,215 447,277 16,469 1,171 481,132 1,552 49,587 51,139 41,324 573,5952009 0 71,800 58 1,958 73,816 14,085 4,301 18,386 32,139 124,341Averages1986-91 7,349,167 619,500 15,333 16,000 8,000,000 77,500 1,928,683 2,006,183 71,000 10,077,1831992-00 4,420,111 834,000 23,111 27,222 5,304,444 112,333 909,111 1,021,444 85,889 6,411,7782001-09 889,044 723,898 59,398 18,410 1,690,750 71,544 232,207 303,751 90,954 2,085,455Percentages1986-91 73% 6% 0% 0% 79% 1% 19% 20% 1% 100%1992-00 69% 13% 0% 0% 83% 2% 14% 16% 1% 100%2001-09 42% 35% 3% 1% 81% 3% 11% 15% 4% 100%18
- Page 2 and 3: Fraser River Sockeye Fisheriesand F
- Page 4 and 5: EXECUTIVE SUMMARY1. Catch Monitorin
- Page 6 and 7: implement harvest rate ceilings to
- Page 8 and 9: Table of ContentsEXECUTIVE SUMMARY
- Page 10 and 11: List of TablesTable 1 Annual estima
- Page 12 and 13: List of FiguresFigure 1 Fraser sock
- Page 14 and 15: Figure 21 Estimates of total catch,
- Page 16 and 17: List of AppendicesAppendix A Statem
- Page 18 and 19: used to (1) estimate catch for each
- Page 22 and 23: Figure 1 Fraser sockeye marine migr
- Page 24 and 25: Table 2 Summary of available inform
- Page 26 and 27: Table 3 provides the annual estimat
- Page 28 and 29: Table 4 Summary of available inform
- Page 30 and 31: season update teleconference meetin
- Page 32 and 33: Catch Estimation MethodsThe procedu
- Page 34 and 35: catch estimates was detected using
- Page 36 and 37: of precision. The overall rating fo
- Page 38 and 39: 1998-00 - No agreements with Sto:lo
- Page 40 and 41: initiation of the AFS Agreements in
- Page 42 and 43: Table 12 Comparison of annual socke
- Page 44 and 45: Table 13 Annual estimates of the ha
- Page 46 and 47: Canadian Commercial FisheriesThe pr
- Page 48 and 49: logbook systems. In addition to the
- Page 50 and 51: Table 15 Fraser River sockeye salmo
- Page 52 and 53: Available catch estimates for the r
- Page 54 and 55: Table 17 Summary of available infor
- Page 56 and 57: anged from less than 100 to over 30
- Page 58 and 59: Washington State Recreational Fishe
- Page 60 and 61: equirements have been applied to se
- Page 62 and 63: salmon were biopsied or tagged with
- Page 64 and 65: Stellako-Late Stuart and 531 Adams)
- Page 66 and 67: FISHERIES MANAGEMENTOverview of Pre
- Page 68 and 69: parents of the recruits). Effective
- Page 70 and 71:
within the confidence limits. For e
- Page 72 and 73:
Ratio of Return to Forecast5.04.03.
- Page 74 and 75:
Ratio of Return to Forecast5.04.03.
- Page 76 and 77:
Table 20 Pre-season forecast models
- Page 78 and 79:
different from the straight line),
- Page 80 and 81:
Prediction ability of ForecastsProp
- Page 82 and 83:
Stock MAPEReturn Explainedby Foreca
- Page 84 and 85:
test fisheries are analyzed in-seas
- Page 86 and 87:
Inputs to the cumulative-normal mod
- Page 88 and 89:
eginning of the runs, but by mid-ru
- Page 90 and 91:
Median Absolute Percent Error (1997
- Page 92 and 93:
variety of hydroacoustic techniques
- Page 94 and 95:
enefited from improved technologies
- Page 96 and 97:
Post-season estimates of Escapement
- Page 98 and 99:
precision achieved was considerably
- Page 100 and 101:
m 3 /sec during the sockeye run. Fi
- Page 102 and 103:
Escapement TargetsOur evaluations r
- Page 104 and 105:
20% of the average of the 4-year se
- Page 106 and 107:
Table 24 Low escapement benchmarks
- Page 108 and 109:
Table 25 Comparison of post-season
- Page 110 and 111:
fisheries have been permitted to ta
- Page 112 and 113:
sub-dominant cycle years (e.g., 200
- Page 114 and 115:
SummaryLow Escapement Benchmarks (L
- Page 116 and 117:
Extent of OverharvestingThe estimat
- Page 118 and 119:
2,000,0001,800,000Early StuartCatch
- Page 120 and 121:
Cultus Lake Sockeye Recovery Effort
- Page 122 and 123:
Figure 23 Number of adult sockeye e
- Page 124 and 125:
Recovery ObjectivesIn anticipation
- Page 126 and 127:
2008 the escapement estimate was 34
- Page 128 and 129:
BRISTOL BAY, ALASKA SOCKEYE FISHERY
- Page 130 and 131:
accurate, precise, and timely, (2)
- Page 132 and 133:
The Bay is subjected to large tidal
- Page 134 and 135:
activity (Bocking and Peterman 1988
- Page 136 and 137:
% of total run45%40%35%30%25%20%15%
- Page 138 and 139:
Harvest estimation methodsTotal har
- Page 140 and 141:
Millions of sockeyeYearFigure 27 Hi
- Page 142 and 143:
management structure complements th
- Page 144 and 145:
1.5Togiak4.03.5NushagakMillions of
- Page 146 and 147:
Millions of sockeye7.06.05.04.03.02
- Page 148 and 149:
logical given the dynamics of the r
- Page 150 and 151:
1.61.4Number of fish (millions)1.21
- Page 152 and 153:
Pre-season forecastsAs noted above,
- Page 154 and 155:
8.0y = 0.79x + 1.59R² = 0.417.8Log
- Page 156 and 157:
12010080MAPE60402001971-1980 1981-1
- Page 158 and 159:
Median percent error (MPE)3020100-1
- Page 160 and 161:
Table 28 Average age composition of
- Page 162 and 163:
dampeners to reduce surface turbule
- Page 164 and 165:
current year’s run is accounted f
- Page 166 and 167:
and 1999 Revised Annexes. This inte
- Page 168 and 169:
Bristol Bay was in 1997 when there
- Page 170 and 171:
upon by managers to determine when
- Page 172 and 173:
STATE OF THE SCIENCECatch Monitorin
- Page 174 and 175:
2006) due to concerns regarding the
- Page 176 and 177:
RECOMMENDATIONS1. DFO needs to ensu
- Page 178 and 179:
LITERATURE CITEDAdkison, M.D. and R
- Page 180 and 181:
Beacham, T.D., M. Lapointe, J.R. Ca
- Page 182 and 183:
CSAS. 2007 Pre-season run size fore
- Page 184 and 185:
Evans, D.G., J.B. Browning and B.G.
- Page 186 and 187:
Hardie, D.C., D.A. Nagtegaal, K. He
- Page 188 and 189:
Pacific Salmon Commission. 1998. Re
- Page 190 and 191:
Robichaud, D., J.J. Smith, K. K. En
- Page 192 and 193:
Valderrama, D. and J.L. Anderson. 2
- Page 194 and 195:
Appendix A Statement of Work.Cohen
- Page 196 and 197:
All sectors3.7 The Contractor will
- Page 198 and 199:
“State of the Science”. Comment
- Page 200 and 201:
3.3 The Contractor will review and
- Page 202 and 203:
Appendix BList of requests to DFO b
- Page 204 and 205:
DFO Request 15: Recent CSAS documen
- Page 206 and 207:
Item Description DateRequestedReque
- Page 208 and 209:
Appendix CFirst Nation catch monito
- Page 210 and 211:
Table C-1 Summary of information re
- Page 212 and 213:
Table C-2 Weekly catch monitoring e
- Page 214 and 215:
Table D-1 Summary of information re
- Page 216 and 217:
community of Port Renfrew. The area
- Page 218 and 219:
IPrecision ( + % of the estimate)10
- Page 220 and 221:
Table E-2 Annual Strait of Georgia
- Page 222 and 223:
Table E-4 Annual Johnstone Strait e
- Page 224 and 225:
Table E-6 Lower Fraser River recrea
- Page 226 and 227:
0 would mean that the forecast does
- Page 228 and 229:
the general ups and downs of the ob
- Page 230 and 231:
Appendix G Graphical representation
- Page 232 and 233:
Early Stuart Timing GroupEarly Stua
- Page 234 and 235:
Summer-run Timing GroupSummer run7.
- Page 236 and 237:
Fraser River Indicator Stocks (list
- Page 238 and 239:
Fraser River Indicator Stocks (list
- Page 240 and 241:
Fraser River Indicator Stocks (list
- Page 242 and 243:
Fraser River Indicator Stocks (list
- Page 244 and 245:
Fraser River Indicator Stocks (list
- Page 246 and 247:
Fraser River Indicator Stocks (list
- Page 248 and 249:
Fraser River Indicator Stocks (list
- Page 250 and 251:
Fraser River Indicator Stocks (list
- Page 252 and 253:
Fraser River Indicator Stocks (list
- Page 254 and 255:
Appendix H Pre-season forecast: sum
- Page 256 and 257:
ManagementGroup(IndicatorStock)MAPE
- Page 258 and 259:
ManagementGroup(IndicatorStock)MAPE
- Page 260 and 261:
Appendix I Methods of In-season Sto
- Page 262 and 263:
Marine Gillnet Test FisheriesThe gi
- Page 264 and 265:
Expansion line (x1000)9080706050403
- Page 266 and 267:
Table I-2 Mean values for purse sei
- Page 268 and 269:
Figure I-5 Map of test fishing loca
- Page 270 and 271:
Appendix J The Hydroacoustics progr
- Page 272 and 273:
An SEF project was secured in 2007
- Page 274 and 275:
Conservation action Comments Partne
- Page 276 and 277:
Table K-2 Summary of actions to rec
- Page 278 and 279:
Table L-1 Catch and escapement of s
- Page 280 and 281:
Table L-3 Performance criteria of p
- Page 282 and 283:
Ratio of annual return to the avera
- Page 284 and 285:
Appendix M Reviewer comments on the
- Page 286 and 287:
Request #5: Sockeye allocations by
- Page 288 and 289:
utility of pre-season forecasts. Pr
- Page 290 and 291:
3. Are there additional quantitativ
- Page 292 and 293:
made via tagging and experimentatio
- Page 294 and 295:
Page 60: The authors make extensive
- Page 296 and 297:
ensure the reader does not assume t
- Page 298 and 299:
The reported excerpts from Bradford
- Page 300 and 301:
(budgets, legal issues, pseudo-cons
- Page 302 and 303:
REVIEW 3/3Reviewer Name: Dr Sean Co
- Page 304 and 305:
season forecasts that eventually co
- Page 306 and 307:
allocation shows "No agreement", an
- Page 308 and 309:
size.Figures showing errors for pre
- Page 310 and 311:
Goals can easily generate confusion
- Page 312 and 313:
Total rows from all these tables be
- Page 314 and 315:
Exploitation Rate100%90%80%70%60%50
- Page 316 and 317:
Exploitation RateEarly Stuart90%80%