- Page 2 and 3:
Fraser River Sockeye Fisheriesand F
- Page 4 and 5:
EXECUTIVE SUMMARY1. Catch Monitorin
- Page 6 and 7:
implement harvest rate ceilings to
- Page 8 and 9:
Table of ContentsEXECUTIVE SUMMARY
- Page 10 and 11:
List of TablesTable 1 Annual estima
- Page 12 and 13:
List of FiguresFigure 1 Fraser sock
- Page 14 and 15:
Figure 21 Estimates of total catch,
- Page 16 and 17:
List of AppendicesAppendix A Statem
- Page 18 and 19:
used to (1) estimate catch for each
- Page 20 and 21:
FISHERIES HARVESTINGOverview of Fis
- Page 22 and 23:
Figure 1 Fraser sockeye marine migr
- Page 24 and 25:
Table 2 Summary of available inform
- Page 26 and 27:
Table 3 provides the annual estimat
- Page 28 and 29:
Table 4 Summary of available inform
- Page 30 and 31:
season update teleconference meetin
- Page 32 and 33:
Catch Estimation MethodsThe procedu
- Page 34 and 35:
catch estimates was detected using
- Page 36 and 37:
of precision. The overall rating fo
- Page 38 and 39:
1998-00 - No agreements with Sto:lo
- Page 40 and 41:
initiation of the AFS Agreements in
- Page 42 and 43:
Table 12 Comparison of annual socke
- Page 44 and 45:
Table 13 Annual estimates of the ha
- Page 46 and 47:
Canadian Commercial FisheriesThe pr
- Page 48 and 49:
logbook systems. In addition to the
- Page 50 and 51:
Table 15 Fraser River sockeye salmo
- Page 52 and 53:
Available catch estimates for the r
- Page 54 and 55:
Table 17 Summary of available infor
- Page 56 and 57:
anged from less than 100 to over 30
- Page 58 and 59:
Washington State Recreational Fishe
- Page 60 and 61:
equirements have been applied to se
- Page 62 and 63:
salmon were biopsied or tagged with
- Page 64 and 65:
Stellako-Late Stuart and 531 Adams)
- Page 66 and 67:
FISHERIES MANAGEMENTOverview of Pre
- Page 68 and 69:
parents of the recruits). Effective
- Page 70 and 71:
within the confidence limits. For e
- Page 72 and 73:
Ratio of Return to Forecast5.04.03.
- Page 74 and 75:
Ratio of Return to Forecast5.04.03.
- Page 76 and 77:
Table 20 Pre-season forecast models
- Page 78 and 79:
different from the straight line),
- Page 80 and 81:
Prediction ability of ForecastsProp
- Page 82 and 83:
Stock MAPEReturn Explainedby Foreca
- Page 84 and 85:
test fisheries are analyzed in-seas
- Page 86 and 87:
Inputs to the cumulative-normal mod
- Page 88 and 89:
eginning of the runs, but by mid-ru
- Page 90 and 91:
Median Absolute Percent Error (1997
- Page 92 and 93:
variety of hydroacoustic techniques
- Page 94 and 95:
enefited from improved technologies
- Page 96 and 97:
Post-season estimates of Escapement
- Page 98 and 99:
precision achieved was considerably
- Page 100 and 101:
m 3 /sec during the sockeye run. Fi
- Page 102 and 103:
Escapement TargetsOur evaluations r
- Page 104 and 105:
20% of the average of the 4-year se
- Page 106 and 107:
Table 24 Low escapement benchmarks
- Page 108 and 109:
Table 25 Comparison of post-season
- Page 110 and 111:
fisheries have been permitted to ta
- Page 112 and 113:
sub-dominant cycle years (e.g., 200
- Page 114 and 115:
SummaryLow Escapement Benchmarks (L
- Page 116 and 117:
Extent of OverharvestingThe estimat
- Page 118 and 119:
2,000,0001,800,000Early StuartCatch
- Page 120 and 121:
Cultus Lake Sockeye Recovery Effort
- Page 122 and 123:
Figure 23 Number of adult sockeye e
- Page 124 and 125:
Recovery ObjectivesIn anticipation
- Page 126 and 127:
2008 the escapement estimate was 34
- Page 128 and 129:
BRISTOL BAY, ALASKA SOCKEYE FISHERY
- Page 130 and 131:
accurate, precise, and timely, (2)
- Page 132 and 133:
The Bay is subjected to large tidal
- Page 134 and 135:
activity (Bocking and Peterman 1988
- Page 136 and 137:
% of total run45%40%35%30%25%20%15%
- Page 138 and 139:
Harvest estimation methodsTotal har
- Page 140 and 141:
Millions of sockeyeYearFigure 27 Hi
- Page 142 and 143:
management structure complements th
- Page 144 and 145:
1.5Togiak4.03.5NushagakMillions of
- Page 146 and 147:
Millions of sockeye7.06.05.04.03.02
- Page 148 and 149:
logical given the dynamics of the r
- Page 150 and 151:
1.61.4Number of fish (millions)1.21
- Page 152 and 153:
Pre-season forecastsAs noted above,
- Page 154 and 155:
8.0y = 0.79x + 1.59R² = 0.417.8Log
- Page 156 and 157:
12010080MAPE60402001971-1980 1981-1
- Page 158 and 159:
Median percent error (MPE)3020100-1
- Page 160 and 161:
Table 28 Average age composition of
- Page 162 and 163:
dampeners to reduce surface turbule
- Page 164 and 165:
current year’s run is accounted f
- Page 166 and 167:
and 1999 Revised Annexes. This inte
- Page 168 and 169: Bristol Bay was in 1997 when there
- Page 170 and 171: upon by managers to determine when
- Page 172 and 173: STATE OF THE SCIENCECatch Monitorin
- Page 174 and 175: 2006) due to concerns regarding the
- Page 176 and 177: RECOMMENDATIONS1. DFO needs to ensu
- Page 178 and 179: LITERATURE CITEDAdkison, M.D. and R
- Page 180 and 181: Beacham, T.D., M. Lapointe, J.R. Ca
- Page 182 and 183: CSAS. 2007 Pre-season run size fore
- Page 184 and 185: Evans, D.G., J.B. Browning and B.G.
- Page 186 and 187: Hardie, D.C., D.A. Nagtegaal, K. He
- Page 188 and 189: Pacific Salmon Commission. 1998. Re
- Page 190 and 191: Robichaud, D., J.J. Smith, K. K. En
- Page 192 and 193: Valderrama, D. and J.L. Anderson. 2
- Page 194 and 195: Appendix A Statement of Work.Cohen
- Page 196 and 197: All sectors3.7 The Contractor will
- Page 198 and 199: “State of the Science”. Comment
- Page 200 and 201: 3.3 The Contractor will review and
- Page 202 and 203: Appendix BList of requests to DFO b
- Page 204 and 205: DFO Request 15: Recent CSAS documen
- Page 206 and 207: Item Description DateRequestedReque
- Page 208 and 209: Appendix CFirst Nation catch monito
- Page 210 and 211: Table C-1 Summary of information re
- Page 212 and 213: Table C-2 Weekly catch monitoring e
- Page 214 and 215: Table D-1 Summary of information re
- Page 216 and 217: community of Port Renfrew. The area
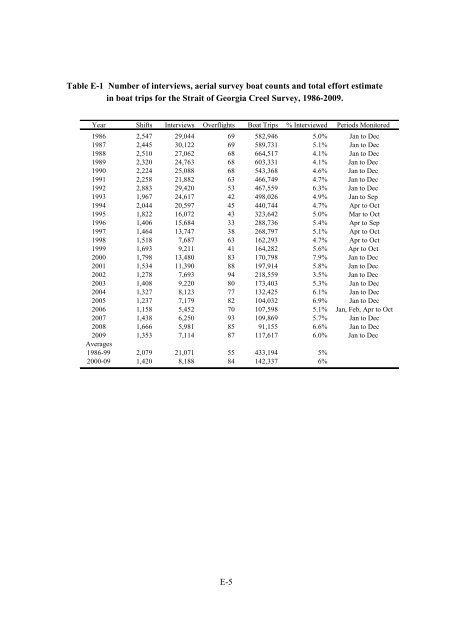
- Page 220 and 221: Table E-2 Annual Strait of Georgia
- Page 222 and 223: Table E-4 Annual Johnstone Strait e
- Page 224 and 225: Table E-6 Lower Fraser River recrea
- Page 226 and 227: 0 would mean that the forecast does
- Page 228 and 229: the general ups and downs of the ob
- Page 230 and 231: Appendix G Graphical representation
- Page 232 and 233: Early Stuart Timing GroupEarly Stua
- Page 234 and 235: Summer-run Timing GroupSummer run7.
- Page 236 and 237: Fraser River Indicator Stocks (list
- Page 238 and 239: Fraser River Indicator Stocks (list
- Page 240 and 241: Fraser River Indicator Stocks (list
- Page 242 and 243: Fraser River Indicator Stocks (list
- Page 244 and 245: Fraser River Indicator Stocks (list
- Page 246 and 247: Fraser River Indicator Stocks (list
- Page 248 and 249: Fraser River Indicator Stocks (list
- Page 250 and 251: Fraser River Indicator Stocks (list
- Page 252 and 253: Fraser River Indicator Stocks (list
- Page 254 and 255: Appendix H Pre-season forecast: sum
- Page 256 and 257: ManagementGroup(IndicatorStock)MAPE
- Page 258 and 259: ManagementGroup(IndicatorStock)MAPE
- Page 260 and 261: Appendix I Methods of In-season Sto
- Page 262 and 263: Marine Gillnet Test FisheriesThe gi
- Page 264 and 265: Expansion line (x1000)9080706050403
- Page 266 and 267: Table I-2 Mean values for purse sei
- Page 268 and 269:
Figure I-5 Map of test fishing loca
- Page 270 and 271:
Appendix J The Hydroacoustics progr
- Page 272 and 273:
An SEF project was secured in 2007
- Page 274 and 275:
Conservation action Comments Partne
- Page 276 and 277:
Table K-2 Summary of actions to rec
- Page 278 and 279:
Table L-1 Catch and escapement of s
- Page 280 and 281:
Table L-3 Performance criteria of p
- Page 282 and 283:
Ratio of annual return to the avera
- Page 284 and 285:
Appendix M Reviewer comments on the
- Page 286 and 287:
Request #5: Sockeye allocations by
- Page 288 and 289:
utility of pre-season forecasts. Pr
- Page 290 and 291:
3. Are there additional quantitativ
- Page 292 and 293:
made via tagging and experimentatio
- Page 294 and 295:
Page 60: The authors make extensive
- Page 296 and 297:
ensure the reader does not assume t
- Page 298 and 299:
The reported excerpts from Bradford
- Page 300 and 301:
(budgets, legal issues, pseudo-cons
- Page 302 and 303:
REVIEW 3/3Reviewer Name: Dr Sean Co
- Page 304 and 305:
season forecasts that eventually co
- Page 306 and 307:
allocation shows "No agreement", an
- Page 308 and 309:
size.Figures showing errors for pre
- Page 310 and 311:
Goals can easily generate confusion
- Page 312 and 313:
Total rows from all these tables be
- Page 314 and 315:
Exploitation Rate100%90%80%70%60%50
- Page 316 and 317:
Exploitation RateEarly Stuart90%80%


