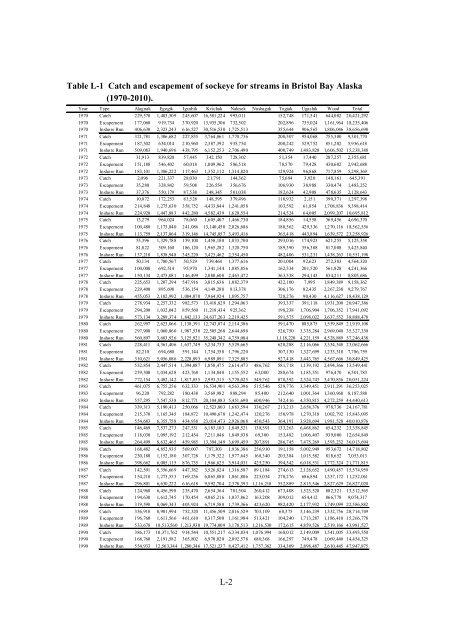
Table L-1 Catch <strong>and</strong> escapement of sockeye for streams in Bristol Bay Alaska(1970-2010).Year Type Alagnak Egegik Igushik Kvichak Naknek Nushagak Togiak Ugashik Wood Total1970 Catch 229,570 1,403,509 245,607 16,581,224 993,011 152,748 171,541 644,082 20,421,2921970 Escapement 177,060 919,734 370,920 13,935,306 732,502 202,896 735,024 1,161,964 18,235,4061970 Inshore Run 406,630 2,323,243 616,527 30,516,530 1,725,513 355,644 906,565 1,806,046 38,656,6981971 Catch 321,781 1,306,682 227,835 3,764,861 1,770,736 200,507 954,068 755,300 9,301,7701971 Escapement 187,302 634,014 210,960 2,387,392 935,754 200,242 529,752 851,202 5,936,6181971 Inshore Run 509,083 1,940,696 438,795 6,152,253 2,706,490 400,749 1,483,820 1,606,502 15,238,3881972 Catch 31,913 839,820 57,445 342,150 728,302 51,354 17,440 287,257 2,355,6811972 Escapement 151,188 546,402 60,018 1,009,962 586,518 78,570 79,428 430,602 2,942,6881972 Inshore Run 183,101 1,386,222 117,463 1,352,112 1,314,820 129,924 96,868 717,859 5,298,3691973 Catch 2,096 221,337 28,030 21,791 144,362 75,694 3,920 148,161 645,3911973 Escapement 35,280 328,842 59,508 226,554 356,676 106,930 38,988 330,474 1,483,2521973 Inshore Run 37,376 550,179 87,538 248,345 501,038 182,624 42,908 478,635 2,128,6431974 Catch 10,072 172,253 83,528 148,595 379,496 110,932 2,151 390,371 1,297,3981974 Escapement 214,848 1,275,630 358,752 4,433,844 1,241,058 103,592 61,854 1,708,836 9,398,4141974 Inshore Run 224,920 1,447,883 442,280 4,582,439 1,620,554 214,524 64,005 2,099,207 10,695,8121975 Catch 13,279 964,024 78,060 1,605,407 1,466,730 184,856 14,558 369,456 4,696,3701975 Escapement 100,480 1,173,840 241,086 13,140,450 2,026,686 180,562 429,336 1,270,116 18,562,5561975 Inshore Run 113,759 2,137,864 319,146 14,745,857 3,493,416 365,418 443,894 1,639,572 23,258,9261976 Catch 55,396 1,329,788 159,100 1,458,180 1,033,700 293,016 174,923 621,255 5,125,3581976 Escapement 81,822 509,160 186,120 1,965,282 1,320,750 189,390 356,308 817,008 5,425,8401976 Inshore Run 137,218 1,838,948 345,220 3,423,462 2,354,450 482,406 531,231 1,438,263 10,551,1981977 Catch 50,134 1,780,567 50,529 739,464 1,377,616 201,004 92,623 272,383 4,564,3201977 Escapement 100,000 692,514 95,970 1,341,144 1,085,856 162,534 201,520 561,828 4,241,3661977 Inshore Run 150,134 2,473,081 146,499 2,080,608 2,463,472 363,538 294,143 834,211 8,805,6861978 Catch 225,653 1,207,294 547,916 3,815,636 1,082,379 422,100 7,995 1,849,389 9,158,3621978 Escapement 229,400 895,698 536,154 4,149,288 813,378 306,176 82,435 2,267,238 9,279,7671978 Inshore Run 455,053 2,102,992 1,084,070 7,964,924 1,895,757 728,276 90,430 4,116,627 18,438,1291979 Catch 278,934 2,257,332 982,573 13,418,829 1,294,063 393,337 391,118 1,931,200 20,947,3861979 Escapement 294,200 1,032,042 859,560 11,218,434 925,362 198,238 1,706,904 1,706,352 17,941,0921979 Inshore Run 573,134 3,289,374 1,842,133 24,637,263 2,219,425 591,575 2,098,022 3,637,552 38,888,4781980 Catch 262,997 2,623,066 1,138,391 12,743,074 2,114,386 591,470 885,875 1,559,849 21,919,1081980 Escapement 297,900 1,060,860 1,987,530 22,505,268 2,644,698 526,750 3,335,284 2,969,040 35,327,3301980 Inshore Run 560,897 3,683,926 3,125,921 35,248,342 4,759,084 1,118,220 4,221,159 4,528,889 57,246,4381981 Catch 228,411 4,361,406 1,637,749 5,234,733 5,529,665 620,288 2,116,066 3,334,348 23,062,6661981 Escapement 82,210 694,680 591,144 1,754,358 1,796,220 307,130 1,327,699 1,233,318 7,786,7591981 Inshore Run 310,621 5,056,086 2,228,893 6,989,091 7,325,885 927,418 3,443,765 4,567,666 30,849,4251982 Catch 532,854 2,447,514 1,394,087 1,858,475 2,614,473 486,762 581,718 1,139,192 2,494,366 13,549,4411982 Escapement 239,300 1,034,628 423,768 1,134,840 1,155,552 63,000 288,674 1,185,551 976,470 6,501,7831982 Inshore Run 772,154 3,482,142 1,817,855 2,993,315 3,770,025 549,762 870,392 2,324,743 3,470,836 20,051,2241983 Catch 461,075 6,755,256 632,333 16,534,901 4,563,396 515,546 529,776 3,349,451 2,911,291 36,253,0251983 Escapement 96,220 792,282 180,438 3,569,982 888,294 85,400 212,640 1,001,364 1,360,968 8,187,5881983 Inshore Run 557,295 7,547,538 812,771 20,104,883 5,451,690 600,946 742,416 4,350,815 4,272,259 44,440,6131984 Catch 339,313 5,190,413 250,066 12,523,803 1,683,594 330,267 213,213 2,658,376 978,736 24,167,7811984 Escapement 215,370 1,165,345 184,872 10,490,670 1,242,474 120,276 150,978 1,270,318 1,002,792 15,843,0951984 Inshore Run 554,683 6,355,758 434,938 23,014,473 2,926,068 450,543 364,191 3,928,694 1,981,528 40,010,8761985 Catch 146,469 7,537,273 247,531 6,183,103 1,849,521 138,591 133,263 6,468,862 654,232 23,358,8451985 Escapement 118,030 1,095,192 212,454 7,211,046 1,849,938 69,300 153,482 1,006,407 939,000 12,654,8491985 Inshore Run 264,499 8,632,465 459,985 13,394,149 3,699,459 207,891 286,745 7,475,269 1,593,232 36,013,6941986 Catch 168,482 4,852,935 569,007 787,303 1,936,386 256,910 191,158 5,002,949 953,672 14,718,8021986 Escapement 230,180 1,152,180 307,728 1,179,322 1,977,645 168,340 203,384 1,015,582 818,652 7,053,0131986 Inshore Run 398,662 6,005,115 876,735 1,966,625 3,914,031 425,250 394,542 6,018,531 1,772,324 21,771,8151987 Catch 142,591 5,356,669 447,382 3,526,824 1,316,587 891,184 274,613 2,128,652 1,490,457 15,574,9591987 Escapement 154,210 1,273,553 169,236 6,065,880 1,061,806 225,034 278,276 686,894 1,337,172 11,252,0611987 Inshore Run 296,801 6,630,222 616,618 9,592,704 2,378,393 1,116,218 552,889 2,815,546 2,827,629 26,827,0201988 Catch 124,968 6,456,598 235,470 2,654,364 701,504 260,412 673,408 1,523,520 882,321 13,512,5651988 Escapement 194,630 1,612,745 170,454 4,065,216 1,037,862 163,208 309,012 654,412 866,778 9,074,3171988 Inshore Run 319,598 8,069,343 405,924 6,719,580 1,739,366 423,620 982,420 2,177,932 1,749,099 22,586,8821989 Catch 336,918 8,901,994 752,320 11,456,509 2,016,529 703,109 68,375 3,146,239 1,332,756 28,714,7491989 Escapement 196,760 1,611,566 461,610 8,317,500 1,161,984 513,421 104,240 1,713,287 1,186,410 15,266,7781989 Inshore Run 533,678 10,513,560 1,213,930 19,774,009 3,178,513 1,216,530 172,615 4,859,526 2,519,166 43,981,5271990 Catch 386,173 10,371,762 914,544 10,551,217 6,334,834 1,076,994 168,012 2,149,009 1,541,005 33,493,5501990 Escapement 168,760 2,191,582 365,802 6,970,020 2,092,578 680,368 166,297 749,478 1,069,440 14,454,3251990 Inshore Run 554,933 12,563,344 1,280,346 17,521,237 8,427,412 1,757,362 334,309 2,898,487 2,610,445 47,947,875L-2
Table L-2 Current sockeye stock assessment activities <strong>and</strong> uses in Bristol Bay Alaska. Table was reproduced from Clark(2005).Project/Activity Pre-Season Forecasts In-Season <strong>Management</strong> Post-Season AssessmentTotal Escapement Assessment(Ugashik, Egegik, Naknek, Branch, Kvichak, Igushik, Wood,Nuyakuk, <strong>and</strong> Togiak Towers <strong>and</strong> Nushagak Sonar projects)Historic annual data used Daily counts <strong>and</strong> cumulative counts usedto estimate run timing <strong>and</strong> strengthAnnual total data usedEscapement Age Composition(Ugashik, Egegik, Naknek, Branch, Kvichak, Igushik, Wood,Nuyakuk, <strong>and</strong> Togiak Tower <strong>and</strong> Nushagak Sonar projects)Historic annual data usedData used for assessment of pre-seasonforecast accuracy <strong>and</strong> for in-seasonassignment of catch to stock of originData used for brood tables<strong>and</strong> for catch allocationsInside Test Fishing <strong>and</strong> Aerial Surveys(Ugashik, Egegik, Naknek-Kvichak, <strong>and</strong> Igushik test fishprojects)Not usedUsed to estimate number of fish abovedistrict but below towerNot usedOutside Test Fishing(Port Moller)Not usedUsed to estimate number of fish that havenot yet reached Bristol BayNot usedCatch Data (daily reports <strong>and</strong> yearend fish tickets)(Ugashik, Egegik, Naknek-Kvichak, Nushagak, <strong>and</strong> Togiakfishing districts)Historic annual data usedUsed to estimate run timing <strong>and</strong> strengthby districtAnnual total data usedCatch Age Composition(Ugashik, Egegik, Naknek-Kvichak, Nushagak, <strong>and</strong> Togiakfishing districts)Historic annual data usedData used for assessment of pre-seasonforecast accuracy <strong>and</strong> for in-seasonassignment of catch to stock of originData used for brood tables<strong>and</strong> for catch allocationsSmolt Enumeration(Kvichak, Naknek, Egegik, Ugashik, Wood, <strong>and</strong> Nuyakuk)Historic annual data used attimesNot usedNot used, but have potentialfor escapement goalsL-3
- Page 2 and 3:
Fraser River Sockeye Fisheriesand F
- Page 4 and 5:
EXECUTIVE SUMMARY1. Catch Monitorin
- Page 6 and 7:
implement harvest rate ceilings to
- Page 8 and 9:
Table of ContentsEXECUTIVE SUMMARY
- Page 10 and 11:
List of TablesTable 1 Annual estima
- Page 12 and 13:
List of FiguresFigure 1 Fraser sock
- Page 14 and 15:
Figure 21 Estimates of total catch,
- Page 16 and 17:
List of AppendicesAppendix A Statem
- Page 18 and 19:
used to (1) estimate catch for each
- Page 20 and 21:
FISHERIES HARVESTINGOverview of Fis
- Page 22 and 23:
Figure 1 Fraser sockeye marine migr
- Page 24 and 25:
Table 2 Summary of available inform
- Page 26 and 27:
Table 3 provides the annual estimat
- Page 28 and 29:
Table 4 Summary of available inform
- Page 30 and 31:
season update teleconference meetin
- Page 32 and 33:
Catch Estimation MethodsThe procedu
- Page 34 and 35:
catch estimates was detected using
- Page 36 and 37:
of precision. The overall rating fo
- Page 38 and 39:
1998-00 - No agreements with Sto:lo
- Page 40 and 41:
initiation of the AFS Agreements in
- Page 42 and 43:
Table 12 Comparison of annual socke
- Page 44 and 45:
Table 13 Annual estimates of the ha
- Page 46 and 47:
Canadian Commercial FisheriesThe pr
- Page 48 and 49:
logbook systems. In addition to the
- Page 50 and 51:
Table 15 Fraser River sockeye salmo
- Page 52 and 53:
Available catch estimates for the r
- Page 54 and 55:
Table 17 Summary of available infor
- Page 56 and 57:
anged from less than 100 to over 30
- Page 58 and 59:
Washington State Recreational Fishe
- Page 60 and 61:
equirements have been applied to se
- Page 62 and 63:
salmon were biopsied or tagged with
- Page 64 and 65:
Stellako-Late Stuart and 531 Adams)
- Page 66 and 67:
FISHERIES MANAGEMENTOverview of Pre
- Page 68 and 69:
parents of the recruits). Effective
- Page 70 and 71:
within the confidence limits. For e
- Page 72 and 73:
Ratio of Return to Forecast5.04.03.
- Page 74 and 75:
Ratio of Return to Forecast5.04.03.
- Page 76 and 77:
Table 20 Pre-season forecast models
- Page 78 and 79:
different from the straight line),
- Page 80 and 81:
Prediction ability of ForecastsProp
- Page 82 and 83:
Stock MAPEReturn Explainedby Foreca
- Page 84 and 85:
test fisheries are analyzed in-seas
- Page 86 and 87:
Inputs to the cumulative-normal mod
- Page 88 and 89:
eginning of the runs, but by mid-ru
- Page 90 and 91:
Median Absolute Percent Error (1997
- Page 92 and 93:
variety of hydroacoustic techniques
- Page 94 and 95:
enefited from improved technologies
- Page 96 and 97:
Post-season estimates of Escapement
- Page 98 and 99:
precision achieved was considerably
- Page 100 and 101:
m 3 /sec during the sockeye run. Fi
- Page 102 and 103:
Escapement TargetsOur evaluations r
- Page 104 and 105:
20% of the average of the 4-year se
- Page 106 and 107:
Table 24 Low escapement benchmarks
- Page 108 and 109:
Table 25 Comparison of post-season
- Page 110 and 111:
fisheries have been permitted to ta
- Page 112 and 113:
sub-dominant cycle years (e.g., 200
- Page 114 and 115:
SummaryLow Escapement Benchmarks (L
- Page 116 and 117:
Extent of OverharvestingThe estimat
- Page 118 and 119:
2,000,0001,800,000Early StuartCatch
- Page 120 and 121:
Cultus Lake Sockeye Recovery Effort
- Page 122 and 123:
Figure 23 Number of adult sockeye e
- Page 124 and 125:
Recovery ObjectivesIn anticipation
- Page 126 and 127:
2008 the escapement estimate was 34
- Page 128 and 129:
BRISTOL BAY, ALASKA SOCKEYE FISHERY
- Page 130 and 131:
accurate, precise, and timely, (2)
- Page 132 and 133:
The Bay is subjected to large tidal
- Page 134 and 135:
activity (Bocking and Peterman 1988
- Page 136 and 137:
% of total run45%40%35%30%25%20%15%
- Page 138 and 139:
Harvest estimation methodsTotal har
- Page 140 and 141:
Millions of sockeyeYearFigure 27 Hi
- Page 142 and 143:
management structure complements th
- Page 144 and 145:
1.5Togiak4.03.5NushagakMillions of
- Page 146 and 147:
Millions of sockeye7.06.05.04.03.02
- Page 148 and 149:
logical given the dynamics of the r
- Page 150 and 151:
1.61.4Number of fish (millions)1.21
- Page 152 and 153:
Pre-season forecastsAs noted above,
- Page 154 and 155:
8.0y = 0.79x + 1.59R² = 0.417.8Log
- Page 156 and 157:
12010080MAPE60402001971-1980 1981-1
- Page 158 and 159:
Median percent error (MPE)3020100-1
- Page 160 and 161:
Table 28 Average age composition of
- Page 162 and 163:
dampeners to reduce surface turbule
- Page 164 and 165:
current year’s run is accounted f
- Page 166 and 167:
and 1999 Revised Annexes. This inte
- Page 168 and 169:
Bristol Bay was in 1997 when there
- Page 170 and 171:
upon by managers to determine when
- Page 172 and 173:
STATE OF THE SCIENCECatch Monitorin
- Page 174 and 175:
2006) due to concerns regarding the
- Page 176 and 177:
RECOMMENDATIONS1. DFO needs to ensu
- Page 178 and 179:
LITERATURE CITEDAdkison, M.D. and R
- Page 180 and 181:
Beacham, T.D., M. Lapointe, J.R. Ca
- Page 182 and 183:
CSAS. 2007 Pre-season run size fore
- Page 184 and 185:
Evans, D.G., J.B. Browning and B.G.
- Page 186 and 187:
Hardie, D.C., D.A. Nagtegaal, K. He
- Page 188 and 189:
Pacific Salmon Commission. 1998. Re
- Page 190 and 191:
Robichaud, D., J.J. Smith, K. K. En
- Page 192 and 193:
Valderrama, D. and J.L. Anderson. 2
- Page 194 and 195:
Appendix A Statement of Work.Cohen
- Page 196 and 197:
All sectors3.7 The Contractor will
- Page 198 and 199:
“State of the Science”. Comment
- Page 200 and 201:
3.3 The Contractor will review and
- Page 202 and 203:
Appendix BList of requests to DFO b
- Page 204 and 205:
DFO Request 15: Recent CSAS documen
- Page 206 and 207:
Item Description DateRequestedReque
- Page 208 and 209:
Appendix CFirst Nation catch monito
- Page 210 and 211:
Table C-1 Summary of information re
- Page 212 and 213:
Table C-2 Weekly catch monitoring e
- Page 214 and 215:
Table D-1 Summary of information re
- Page 216 and 217:
community of Port Renfrew. The area
- Page 218 and 219:
IPrecision ( + % of the estimate)10
- Page 220 and 221:
Table E-2 Annual Strait of Georgia
- Page 222 and 223:
Table E-4 Annual Johnstone Strait e
- Page 224 and 225:
Table E-6 Lower Fraser River recrea
- Page 226 and 227:
0 would mean that the forecast does
- Page 228 and 229: the general ups and downs of the ob
- Page 230 and 231: Appendix G Graphical representation
- Page 232 and 233: Early Stuart Timing GroupEarly Stua
- Page 234 and 235: Summer-run Timing GroupSummer run7.
- Page 236 and 237: Fraser River Indicator Stocks (list
- Page 238 and 239: Fraser River Indicator Stocks (list
- Page 240 and 241: Fraser River Indicator Stocks (list
- Page 242 and 243: Fraser River Indicator Stocks (list
- Page 244 and 245: Fraser River Indicator Stocks (list
- Page 246 and 247: Fraser River Indicator Stocks (list
- Page 248 and 249: Fraser River Indicator Stocks (list
- Page 250 and 251: Fraser River Indicator Stocks (list
- Page 252 and 253: Fraser River Indicator Stocks (list
- Page 254 and 255: Appendix H Pre-season forecast: sum
- Page 256 and 257: ManagementGroup(IndicatorStock)MAPE
- Page 258 and 259: ManagementGroup(IndicatorStock)MAPE
- Page 260 and 261: Appendix I Methods of In-season Sto
- Page 262 and 263: Marine Gillnet Test FisheriesThe gi
- Page 264 and 265: Expansion line (x1000)9080706050403
- Page 266 and 267: Table I-2 Mean values for purse sei
- Page 268 and 269: Figure I-5 Map of test fishing loca
- Page 270 and 271: Appendix J The Hydroacoustics progr
- Page 272 and 273: An SEF project was secured in 2007
- Page 274 and 275: Conservation action Comments Partne
- Page 276 and 277: Table K-2 Summary of actions to rec
- Page 280 and 281: Table L-3 Performance criteria of p
- Page 282 and 283: Ratio of annual return to the avera
- Page 284 and 285: Appendix M Reviewer comments on the
- Page 286 and 287: Request #5: Sockeye allocations by
- Page 288 and 289: utility of pre-season forecasts. Pr
- Page 290 and 291: 3. Are there additional quantitativ
- Page 292 and 293: made via tagging and experimentatio
- Page 294 and 295: Page 60: The authors make extensive
- Page 296 and 297: ensure the reader does not assume t
- Page 298 and 299: The reported excerpts from Bradford
- Page 300 and 301: (budgets, legal issues, pseudo-cons
- Page 302 and 303: REVIEW 3/3Reviewer Name: Dr Sean Co
- Page 304 and 305: season forecasts that eventually co
- Page 306 and 307: allocation shows "No agreement", an
- Page 308 and 309: size.Figures showing errors for pre
- Page 310 and 311: Goals can easily generate confusion
- Page 312 and 313: Total rows from all these tables be
- Page 314 and 315: Exploitation Rate100%90%80%70%60%50
- Page 316 and 317: Exploitation RateEarly Stuart90%80%