Decision-makingLow- <strong>and</strong> middle-income countriesHigh-income countriesCause Deaths Cause Deaths(millions)(millions)1 Perinatal conditions 2.49 20.7% 1 Perinatal conditions 0.03 33.9%2 Lower respira<strong>to</strong>ry infections 2.04 17.0% 2 Congenital anomalies 0.02 20.0%3 Diarrhoeal diseases 1.61 13.4% 3 Road traffic accidents 0.01 5.9%4 Malaria 1.10 9.2% 4 Lower respira<strong>to</strong>ry infections 0.00 2.5%5 Measles 0.74 6.2% 5 Endocrine disorders 0.00 2.4%6 HIV/AIDS 0.44 3.7% 6 Drownings 0.00 2.4%7 Congenital anomalies 0.44 3.7% 7 Leukemia 0.00 1.9%8 Whooping cough 0.30 2.5% 8 Violence 0.00 1.8%9 Tetanus 0.22 1.9% 9 Fires 0.00 1.2%10 Road traffic accidents 0.18 1.5% 10 Meningitis* 0.00 1.2%Table 4: The 10 leading causes of death in children aged 0–14, by broad income group, 200160 <strong>and</strong> over in all regions. Globally, 60-year-olds have a 55%chance of dying before <strong>the</strong>ir 70th birthday. Regional variationsin <strong>the</strong> risk of death are smaller at older ages than at youngerages, ranging from around 40% in <strong>the</strong> developed countries ofWestern Europe <strong>to</strong> 60% in most developing regions <strong>and</strong> 70%in sub-Saharan Africa. His<strong>to</strong>rical data from countries such asAustralia <strong>and</strong> Sweden show that life expectancy at age 60changed slowly during <strong>the</strong> first six <strong>to</strong> seven decades of <strong>the</strong>20th century, but started <strong>to</strong> increase substantially sincearound 1970. Life expectancy at age 60 has now <strong>reach</strong>ed 25years in Japan. In Eastern Europe from 1990 onwards,Hungary, <strong>and</strong> Pol<strong>and</strong> started <strong>to</strong> experience similarimprovements in mortality for older people, but Russia hasnot, <strong>and</strong> is actually experiencing a worsening trend.Regional variations in causes of deathThe 10 leading causes of mortality differ greatly betweenregions (Table 6). IHD <strong>and</strong> cerebrovascular disease areamong <strong>the</strong> <strong>to</strong>p four causes of death in all low- <strong>and</strong> middleincomeregions except sub-Saharan Africa, where <strong>the</strong>y are8th <strong>and</strong> 7th, respectively. Cerebrovascular disease is <strong>the</strong>leading cause of death in East Asia <strong>and</strong> <strong>the</strong> Pacific, unlike inmost o<strong>the</strong>r regions, where IHD causes more deaths thancerebrovascular disease. In sub-Saharan Africa, 6 of <strong>the</strong> <strong>to</strong>p10 causes are communicable diseases, with HIV/AIDS being<strong>the</strong> leading cause of death, followed by malaria <strong>and</strong> lowerrespira<strong>to</strong>ry infections.South Asia (mainly India) <strong>and</strong> Latin America <strong>and</strong> <strong>the</strong>Caribbean are <strong>the</strong> only two o<strong>the</strong>r low- <strong>and</strong> middle-incomeregions where HIV/AIDS is one of <strong>the</strong> <strong>to</strong>p 10 causes of death.Lower respira<strong>to</strong>ry infections, primarily pneumonia, are <strong>the</strong>third leading cause of death, especially among childrenunder five, who account for 60% of <strong>the</strong>se deaths. Chronicobstructive pulmonary disease kills more people (1.4 million)in <strong>the</strong> East Asia <strong>and</strong> Pacific region, primarily China, thananywhere else in <strong>the</strong> world, with 50% of global mortalityfrom <strong>the</strong> disease occurring <strong>the</strong>re.Europe <strong>and</strong> Central Asia differs from all o<strong>the</strong>r low- <strong>and</strong>middle-income regions in <strong>the</strong> size of <strong>the</strong> CVD epidemic (withalmost 60% of deaths due <strong>to</strong> CVD), followed by trachea,bronchus, <strong>and</strong> lung cancers in third place. Self-inflicted injuries(suicide) are <strong>the</strong> fifth leading cause of death in this region.South Asia is <strong>the</strong> only o<strong>the</strong>r region where suicide is in <strong>the</strong> <strong>to</strong>p10 causes of death. Latin America <strong>and</strong> <strong>the</strong> Caribbean isdistinguished as <strong>the</strong> only region where violence falls in <strong>the</strong> <strong>to</strong>p10 causes of death, responsible for 1 in 25 deaths. In all low<strong>and</strong>middle-income regions apart from Europe <strong>and</strong> Central Asia,road traffic accidents are included among <strong>the</strong> <strong>to</strong>p 10 causes ofdeath, <strong>reach</strong>ing fifth position in <strong>the</strong> Middle East <strong>and</strong> NorthAfrica, where <strong>the</strong>y are responsible for 1 in 20 deaths.Global burden of disease in 2001The 20 leading causes of burden of disease for both sexes<strong>to</strong>ge<strong>the</strong>r are shown in Table 7. While <strong>the</strong> two leading causesLow- <strong>and</strong> middle-income countriesHigh-income countriesCause Deaths Cause Deaths(millions)(millions)1 HIV/AIDS 2.05 14.1% 1 Ischaemic heart disease 0.13 10.8%2 Ischaemic heart disease 1.18 8.1% 2 Self-inflicted injuries 0.09 7.2%3 Tuberculosis 1.03 7.1% 3 Road traffic accidents 0.08 6.9%4 Road traffic accidents 0.73 5.0% 4 Trachea, bronchus, lung cancers 0.08 6.8%5 Cerebrovascular disease 0.71 4.9% 5 Cerebrovascular disease 0.05 4.4%6 Self-inflicted injuries 0.58 4.0% 6 Cirrhosis of <strong>the</strong> liver 0.05 4.4%7 Violence 0.45 3.1% 7 Breast cancer 0.05 4.0%8 Lower respira<strong>to</strong>ry infections 0.33 2.3% 8 Colon <strong>and</strong> rectum cancers 0.04 3.1%9 Cirrhosis of <strong>the</strong> liver 0.32 2.2% 9 Diabetes mellitus 0.03 2.1%10 Chronic obstructivepulmonary disease 0.32 2.2% 10 S<strong>to</strong>mach cancer 0.02 2.0%Table 5: The 10 leading causes of death in adults aged 15–59, by broad income group, 2001170 ✜ Global Forum Update on Research for Health Volume 4
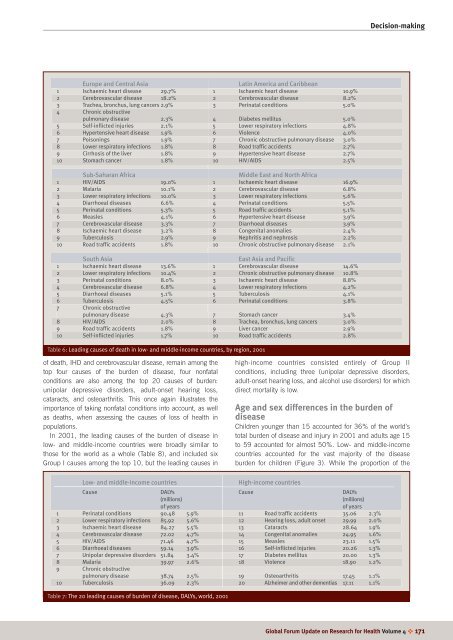
Decision-makingEurope <strong>and</strong> Central AsiaLatin America <strong>and</strong> Caribbean1 Ischaemic heart disease 29.7% 1 Ischaemic heart disease 10.9%2 Cerebrovascular disease 18.2% 2 Cerebrovascular disease 8.2%3 Trachea, bronchus, lung cancers 2.9% 3 Perinatal conditions 5.0%4 Chronic obstructivepulmonary disease 2.3% 4 Diabetes mellitus 5.0%5 Self-inflicted injuries 2.1% 5 Lower respira<strong>to</strong>ry infections 4.8%6 Hypertensive heart disease 1.9% 6 Violence 4.0%7 Poisonings 1.9% 7 Chronic obstructive pulmonary disease 3.0%8 Lower respira<strong>to</strong>ry infections 1.8% 8 Road traffic accidents 2.7%9 Cirrhosis of <strong>the</strong> liver 1.8% 9 Hypertensive heart disease 2.7%10 S<strong>to</strong>mach cancer 1.8% 10 HIV/AIDS 2.5%Sub-Saharan AfricaMiddle East <strong>and</strong> North Africa1 HIV/AIDS 19.0% 1 Ischaemic heart disease 16.9%2 Malaria 10.1% 2 Cerebrovascular disease 6.8%3 Lower respira<strong>to</strong>ry infections 10.0% 3 Lower respira<strong>to</strong>ry infections 5.6%4 Diarrhoeal diseases 6.6% 4 Perinatal conditions 5.5%5 Perinatal conditions 5.3% 5 Road traffic accidents 5.1%6 Measles 4.1% 6 Hypertensive heart disease 3.9%7 Cerebrovascular disease 3.3% 7 Diarrhoeal diseases 3.9%8 Ischaemic heart disease 3.2% 8 Congenital anomalies 2.4%9 Tuberculosis 2.9% 9 Nephritis <strong>and</strong> nephrosis 2.2%10 Road traffic accidents 1.8% 10 Chronic obstructive pulmonary disease 2.1%South AsiaEast Asia <strong>and</strong> Pacific1 Ischaemic heart disease 13.6% 1 Cerebrovascular disease 14.6%2 Lower respira<strong>to</strong>ry infections 10.4% 2 Chronic obstructive pulmonary disease 10.8%3 Perinatal conditions 8.0% 3 Ischaemic heart disease 8.8%4 Cerebrovascular disease 6.8% 4 Lower respira<strong>to</strong>ry infections 4.2%5 Diarrhoeal diseases 5.1% 5 Tuberculosis 4.1%6 Tuberculosis 4.5% 6 Perinatal conditions 3.8%7 Chronic obstructivepulmonary disease 4.3% 7 S<strong>to</strong>mach cancer 3.4%8 HIV/AIDS 2.0% 8 Trachea, bronchus, lung cancers 3.0%9 Road traffic accidents 1.8% 9 Liver cancer 2.9%10 Self-inflicted injuries 1.7% 10 Road traffic accidents 2.8%Table 6: Leading causes of death in low- <strong>and</strong> middle-income countries, by region, 2001of death, IHD <strong>and</strong> cerebrovascular disease, remain among <strong>the</strong><strong>to</strong>p four causes of <strong>the</strong> burden of disease, four nonfatalconditions are also among <strong>the</strong> <strong>to</strong>p 20 causes of burden:unipolar depressive disorders, adult-onset hearing loss,cataracts, <strong>and</strong> osteoarthritis. This once again illustrates <strong>the</strong>importance of taking nonfatal conditions in<strong>to</strong> account, as wellas deaths, when assessing <strong>the</strong> causes of loss of <strong>health</strong> inpopulations.In 2001, <strong>the</strong> leading causes of <strong>the</strong> burden of disease inlow- <strong>and</strong> middle-income countries were broadly similar <strong>to</strong>those for <strong>the</strong> world as a whole (Table 8), <strong>and</strong> included sixGroup I causes among <strong>the</strong> <strong>to</strong>p 10, but <strong>the</strong> leading causes inhigh-income countries consisted entirely of Group IIconditions, including three (unipolar depressive disorders,adult-onset hearing loss, <strong>and</strong> alcohol use disorders) for whichdirect mortality is low.Age <strong>and</strong> sex differences in <strong>the</strong> burden ofdiseaseChildren younger than 15 accounted for 36% of <strong>the</strong> world’s<strong>to</strong>tal burden of disease <strong>and</strong> injury in 2001 <strong>and</strong> adults age 15<strong>to</strong> 59 accounted for almost 50%. Low- <strong>and</strong> middle-incomecountries accounted for <strong>the</strong> vast majority of <strong>the</strong> diseaseburden for children (Figure 3). While <strong>the</strong> proportion of <strong>the</strong>Low- <strong>and</strong> middle-income countriesHigh-income countriesCause DALYs Cause DALYs(millions)(millions)of yearsof years1 Perinatal conditions 90.48 5.9% 11 Road traffic accidents 35.06 2.3%2 Lower respira<strong>to</strong>ry infections 85.92 5.6% 12 Hearing loss, adult onset 29.99 2.0%3 Ischaemic heart disease 84.27 5.5% 13 Cataracts 28.64 1.9%4 Cerebrovascular disease 72.02 4.7% 14 Congenital anomalies 24.95 1.6%5 HIV/AIDS 71.46 4.7% 15 Measles 23.11 1.5%6 Diarrhoeal diseases 59.14 3.9% 16 Self-inflicted injuries 20.26 1.3%7 Unipolar depressive disorders 51.84 3.4% 17 Diabetes mellitus 20.00 1.3%8 Malaria 39.97 2.6% 18 Violence 18.90 1.2%9 Chronic obstructivepulmonary disease 38.74 2.5% 19 Osteoarthritis 17.45 1.1%10 Tuberculosis 36.09 2.3% 20 Alzheimer <strong>and</strong> o<strong>the</strong>r dementias 17.11 1.1%Table 7: The 20 leading causes of burden of disease, DALYs, world, 2001Global Forum Update on Research for Health Volume 4 ✜ 171


![[re-tender] RFQ for supply of Diesel Generator - Brac](https://img.yumpu.com/44421374/1/186x260/re-tender-rfq-for-supply-of-diesel-generator-brac.jpg?quality=85)