Access <strong>to</strong> <strong>health</strong><strong>Combining</strong> <strong>health</strong> <strong>and</strong> <strong>social</strong><strong>protection</strong> <strong>measures</strong> <strong>to</strong> <strong>reach</strong> <strong>the</strong><strong>ultra</strong> poor: experiences of BRACArticle by Syed Masud AhmedPoverty is considered as <strong>the</strong> “biggest epidemic that<strong>the</strong> global public <strong>health</strong> community faces” in <strong>the</strong>contemporary world 1 . Of all risks facing poorhouseholds, <strong>health</strong> “shocks” probably pose <strong>the</strong> greatest threat<strong>to</strong> <strong>the</strong>ir lives <strong>and</strong> livelihoods 2 . Moreover, due <strong>to</strong> <strong>the</strong> operationof <strong>the</strong> “inverse care law” 3 , <strong>the</strong> poor who need <strong>health</strong> caremost are least likely <strong>to</strong> get it 4 . Neglect, abuse <strong>and</strong>marginalization by <strong>the</strong> <strong>health</strong> system are part of <strong>the</strong>ireveryday experience 5 . Cost burdens of <strong>health</strong> care thus deteror delay <strong>health</strong> care utilization or promote use of less effective<strong>health</strong> care sources or practices by <strong>the</strong> poor 6 . Various crisiscoping mechanisms such as selling of productive assets,mortgaging l<strong>and</strong>, or borrowing from money-lenders at highinterest rates <strong>to</strong> cover <strong>the</strong> costs of illness push <strong>the</strong>se householdsin<strong>to</strong> a “poverty trap” from which <strong>the</strong>y rarely recover 7 .Society in Bangladesh is characterized by substantial socioeconomic<strong>and</strong> gender differentials in <strong>health</strong> status 8 , <strong>health</strong>care access <strong>and</strong> utilization 9 <strong>and</strong> <strong>health</strong> benefits gained frompublic <strong>and</strong> private <strong>health</strong> expenditures 10 , all disfavouring <strong>the</strong>poor. The poor in rural Bangladesh lack access <strong>to</strong> quality<strong>health</strong> care due <strong>to</strong> both supply-side (e.g., geographical,skilled manpower, supplies, user-fees/“out-of-pocket” costsetc.) 11 <strong>and</strong> dem<strong>and</strong>-side barriers (e.g., information, financial,socio-cultural barriers, etc.) 12 . Overall, it costs about twice asmuch <strong>to</strong> visit a government <strong>health</strong> service as <strong>to</strong> visit anunqualified practitioner, <strong>and</strong> about twice as much again <strong>to</strong>visit a private qualified practitioner. As a result, ei<strong>the</strong>r <strong>the</strong>yhave <strong>to</strong> forego any treatment or rely mostly on unqualified orsemi-qualified providers in <strong>the</strong> informal/private sec<strong>to</strong>r, whomay account for 50–75% of visits outside home 13 . Theeconomic consequences of ill <strong>health</strong> for <strong>the</strong> poor householdsin Bangladesh, especially <strong>the</strong> bot<strong>to</strong>m 15–20%, is welldocumented 14 . Thus, enhancing poor people’s ability <strong>to</strong>access quality <strong>health</strong> care at low cost has a potential povertyalleviatingeffect in Bangladesh.Different types of intervention are suggested for meeting <strong>the</strong><strong>health</strong> care needs of <strong>the</strong> poor such as universal coverage,cash transfers, voucher schemes, exemption, communitybased<strong>health</strong> insurance, <strong>and</strong> o<strong>the</strong>r strategies such ascontracting out services <strong>to</strong> <strong>the</strong> private or NGO sec<strong>to</strong>r 15 .However, <strong>the</strong>re is scant evidence of <strong>the</strong> impact of <strong>the</strong>se smallscaleinterventions on <strong>the</strong> <strong>health</strong> of <strong>the</strong> poor, especially <strong>the</strong>most vulnerable among <strong>the</strong>m. In this paper we will describewith evidence a programme undertaken by BuildingResources Across Communities (BRAC) 16 , which combined<strong>health</strong> <strong>and</strong> <strong>social</strong> <strong>protection</strong> interventions <strong>to</strong> address <strong>the</strong><strong>health</strong> care needs of <strong>the</strong> poorest among <strong>the</strong> poor, besidespoverty alleviation.BRAC’s “Challenging <strong>the</strong> frontiers of povertyreduction/targeting <strong>ultra</strong> poor, targeting<strong>social</strong> constraints (CFPR/TUP)” programmeIn Bangladesh, <strong>the</strong> proportion of population falling below <strong>the</strong>lower poverty line 17 (corresponding <strong>to</strong> <strong>the</strong> consumption of1805 kcal per person per day) are variously termed as“extreme poor”, “poorest of <strong>the</strong> poor” or “<strong>ultra</strong> poor” 18 . These<strong>ultra</strong> poor households 19 have few or no asset base, are highlyvulnerable <strong>to</strong> any shock (e.g., natural disaster, illnessesrequiring in-patient or costly out-patient care, death ordisability of an income-earner), <strong>and</strong> mainly depend on wagelabourfor survival. They comprise one of <strong>the</strong> major (around36% of <strong>the</strong> population) disadvantaged 20 population groups inrural Bangladesh.BRAC’s regular intervention integrates microcredit-basedincome-earning activities with skill-building <strong>and</strong> <strong>social</strong>awareness raising activities, in addition <strong>to</strong> essential <strong>health</strong> careservices 21 <strong>to</strong> reduce vulnerability of <strong>the</strong> households againstincome-erosion from illness. However, research at BRAC <strong>and</strong>o<strong>the</strong>r similar organizations showed that regular microcreditbasedintervention is not enough <strong>to</strong> effectively <strong>reach</strong> <strong>the</strong> mostvulnerable section among <strong>the</strong> poor, i.e. <strong>the</strong> <strong>ultra</strong> poor in ruralBangladesh due <strong>to</strong> various structural fac<strong>to</strong>rs 22 . This led BRAC<strong>to</strong> revisit its development paradigm <strong>and</strong> ultimately develop thiscus<strong>to</strong>mized grants-based, integrated intervention for <strong>the</strong> <strong>ultra</strong>poor 23 . Once <strong>the</strong> grants phase is over, it is presumed that <strong>the</strong><strong>ultra</strong> poor population will attain a foundation for a sustainablelivelihood, <strong>and</strong> be able <strong>to</strong> participate in <strong>and</strong> benefit frommainstream microcredit programmes.The intervention was undertaken as an operation researchproject <strong>to</strong> develop a module of integrated <strong>health</strong> <strong>and</strong> <strong>social</strong><strong>protection</strong> intervention for <strong>the</strong> <strong>ultra</strong> poor. Launched in 2002,<strong>the</strong> first phase of <strong>the</strong> intervention covered all <strong>the</strong> 21 subdistricts(upazilas 24 ) of <strong>the</strong> three purposively selected famine<strong>and</strong>/or flood-prone districts in nor<strong>the</strong>rn Bangladesh with ahigh concentration of extreme poor households. The <strong>ultra</strong>poor households were selected through a meticulous process034 ✜ Global Forum Update on Research for Health Volume 4
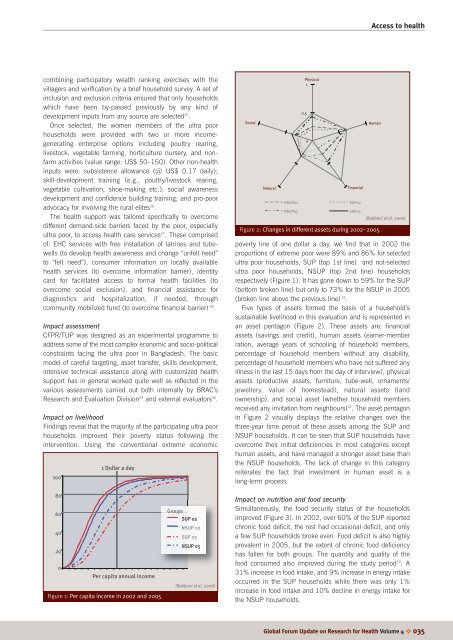
Access <strong>to</strong> <strong>health</strong>combining participa<strong>to</strong>ry wealth ranking exercises with <strong>the</strong>villagers <strong>and</strong> verification by a brief household survey. A set ofinclusion <strong>and</strong> exclusion criteria ensured that only householdswhich have been by-passed previously by any kind ofdevelopment inputs from any source are selected 25 .Once selected, <strong>the</strong> women members of <strong>the</strong> <strong>ultra</strong> poorhouseholds were provided with two or more incomegeneratingenterprise options including poultry rearing,lives<strong>to</strong>ck, vegetable farming, horticulture nursery, <strong>and</strong> nonfarmactivities (value range: US$ 50–150). O<strong>the</strong>r non-<strong>health</strong>inputs were: subsistence allowance (@ US$ 0.17 daily);skill-development training (e.g., poultry/lives<strong>to</strong>ck rearing,vegetable cultivation, shoe-making etc.); <strong>social</strong> awarenessdevelopment <strong>and</strong> confidence building training; <strong>and</strong> pro-pooradvocacy for involving <strong>the</strong> rural elites 26 .The <strong>health</strong> support was tailored specifically <strong>to</strong> overcomedifferent dem<strong>and</strong>-side barriers faced by <strong>the</strong> poor, especially<strong>ultra</strong> poor, <strong>to</strong> access <strong>health</strong> care services 27 . These comprisedof: EHC services with free installation of latrines <strong>and</strong> tubewells(<strong>to</strong> develop <strong>health</strong> awareness <strong>and</strong> change “unfelt need”<strong>to</strong> “felt need”), consumer information on locally available<strong>health</strong> services (<strong>to</strong> overcome information barrier), identitycard for facilitated access <strong>to</strong> formal <strong>health</strong> facilities (<strong>to</strong>overcome <strong>social</strong> exclusion), <strong>and</strong> financial assistance fordiagnostics <strong>and</strong> hospitalization, if needed, throughcommunity mobilized fund (<strong>to</strong> overcome financial barrier) 28 .Impact assessmentCFPR/TUP was designed as an experimental programme <strong>to</strong>address some of <strong>the</strong> most complex economic <strong>and</strong> socio-politicalconstraints facing <strong>the</strong> <strong>ultra</strong> poor in Bangladesh. The basicmodel of careful targeting, asset transfer, skills development,intensive technical assistance along with cus<strong>to</strong>mized <strong>health</strong>support has in general worked quite well as reflected in <strong>the</strong>various assessments carried out both internally by BRAC’sResearch <strong>and</strong> Evaluation Division 29 <strong>and</strong> external evalua<strong>to</strong>rs 30 .Impact on livelihoodFindings reveal that <strong>the</strong> majority of <strong>the</strong> participating <strong>ultra</strong> poorhouseholds improved <strong>the</strong>ir poverty status following <strong>the</strong>intervention. Using <strong>the</strong> conventional extreme economic1001 Dollar a daySocialNaturalNSUP02NSUP05Physical10.50FinancialSUP02SUP05HumanFigure 2: Changes in different assets during 2002–2005(Rabbani et al. 2006)poverty line of one dollar a day, we find that in 2002 <strong>the</strong>proportions of extreme poor were 89% <strong>and</strong> 86% for selected<strong>ultra</strong> poor households, SUP (<strong>to</strong>p 1st line) <strong>and</strong> not-selected<strong>ultra</strong> poor households, NSUP (<strong>to</strong>p 2nd line) householdsrespectively (Figure 1). It has gone down <strong>to</strong> 59% for <strong>the</strong> SUP(bot<strong>to</strong>m broken line) but only <strong>to</strong> 73% for <strong>the</strong> NSUP in 2005(broken line above <strong>the</strong> previous line) 31 .Five types of assets formed <strong>the</strong> basis of a household’ssustainable livelihood in this evaluation <strong>and</strong> is represented inan asset pentagon (Figure 2). These assets are: financialassets (savings <strong>and</strong> credit), human assets (earner-memberration, average years of schooling of household members,percentage of household members without any disability,percentage of household members who have not suffered anyillness in <strong>the</strong> last 15 days from <strong>the</strong> day of interview), physicalassets (productive assets, furniture, tube-well, ornaments/jewellery, value of homestead), natural assets (l<strong>and</strong>ownership), <strong>and</strong> <strong>social</strong> asset (whe<strong>the</strong>r household membersreceived any invitation from neighbours) 32 . The asset pentagonin Figure 2 visually displays <strong>the</strong> relative changes over <strong>the</strong>three-year time period of <strong>the</strong>se assets among <strong>the</strong> SUP <strong>and</strong>NSUP households. It can be seen that SUP households haveovercome <strong>the</strong>ir initial deficiencies in most categories excepthuman assets, <strong>and</strong> have managed a stronger asset base than<strong>the</strong> NSUP households. The lack of change in this categoryreiterates <strong>the</strong> fact that investment in human asset is along-term process.806040200Per capita annual incomeFigure 1: Per capita income in 2002 <strong>and</strong> 2005GroupsSUP 02NSUP 02SUP 05NSUP 05(Rabbani et al. 2006)Impact on nutrition <strong>and</strong> food securitySimultaneously, <strong>the</strong> food security status of <strong>the</strong> householdsimproved (Figure 3). In 2002, over 60% of <strong>the</strong> SUP reportedchronic food deficit, <strong>the</strong> rest had occasional deficit, <strong>and</strong> onlya few SUP households broke even. Food deficit is also highlyprevalent in 2005, but <strong>the</strong> extent of chronic food deficiencyhas fallen for both groups. The quantity <strong>and</strong> quality of <strong>the</strong>food consumed also improved during <strong>the</strong> study period 33 . A31% increase in food intake, <strong>and</strong> 9% increase in energy intakeoccurred in <strong>the</strong> SUP households while <strong>the</strong>re was only 1%increase in food intake <strong>and</strong> 10% decline in energy intake for<strong>the</strong> NSUP households.Global Forum Update on Research for Health Volume 4 ✜ 035


![[re-tender] RFQ for supply of Diesel Generator - Brac](https://img.yumpu.com/44421374/1/186x260/re-tender-rfq-for-supply-of-diesel-generator-brac.jpg?quality=85)