Defining CCS Ready: An Approach to An International Definition
Defining CCS Ready: An Approach to An International Definition
Defining CCS Ready: An Approach to An International Definition
- No tags were found...
Create successful ePaper yourself
Turn your PDF publications into a flip-book with our unique Google optimized e-Paper software.
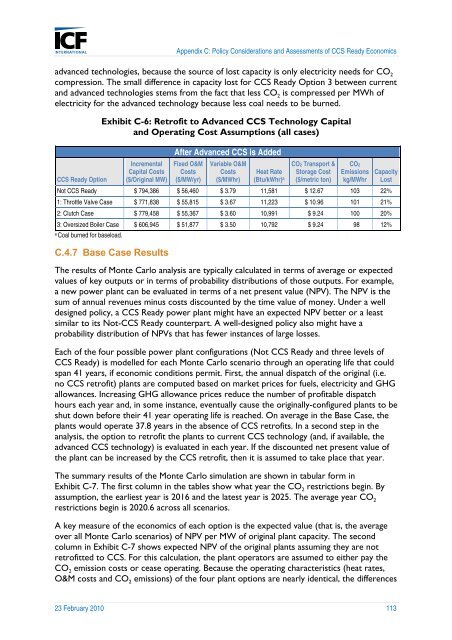
Appendix C: Policy Considerations and Assessments of <strong>CCS</strong> <strong>Ready</strong> Economicsadvanced technologies, because the source of lost capacity is only electricity needs for CO 2compression. The small difference in capacity lost for <strong>CCS</strong> <strong>Ready</strong> Option 3 between currentand advanced technologies stems from the fact that less CO 2 is compressed per MWh ofelectricity for the advanced technology because less coal needs <strong>to</strong> be burned.Exhibit C-6: Retrofit <strong>to</strong> Advanced <strong>CCS</strong> Technology Capitaland Operating Cost Assumptions (all cases)After Advanced <strong>CCS</strong> is Added<strong>CCS</strong> <strong>Ready</strong> OptionIncrementalCapital Costs($/Original MW)Fixed O&MCosts($/MW/yr)Variable O&MCosts($/MWhr)Heat Rate(Btu/kWhr) aCO2 Transport &S<strong>to</strong>rage Cost($/metric <strong>to</strong>n)CO2Emissionskg/MWhrCapacityLostNot <strong>CCS</strong> <strong>Ready</strong> $ 794,386 $ 56,460 $ 3.79 11,581 $ 12.67 103 22%1: Throttle Valve Case $ 771,838 $ 55,815 $ 3.67 11,223 $ 10.96 101 21%2: Clutch Case $ 779,458 $ 55,367 $ 3.60 10,991 $ 9.24 100 20%3: Oversized Boiler Case $ 606,945 $ 51,877 $ 3.50 10,792 $ 9.24 98 12%aCoal burned for baseload.C.4.7 Base Case ResultsThe results of Monte Carlo analysis are typically calculated in terms of average or expectedvalues of key outputs or in terms of probability distributions of those outputs. For example,a new power plant can be evaluated in terms of a net present value (NPV). The NPV is thesum of annual revenues minus costs discounted by the time value of money. Under a welldesigned policy, a <strong>CCS</strong> <strong>Ready</strong> power plant might have an expected NPV better or a leastsimilar <strong>to</strong> its Not-<strong>CCS</strong> <strong>Ready</strong> counterpart. A well-designed policy also might have aprobability distribution of NPVs that has fewer instances of large losses.Each of the four possible power plant configurations (Not <strong>CCS</strong> <strong>Ready</strong> and three levels of<strong>CCS</strong> <strong>Ready</strong>) is modelled for each Monte Carlo scenario through an operating life that couldspan 41 years, if economic conditions permit. First, the annual dispatch of the original (i.e.no <strong>CCS</strong> retrofit) plants are computed based on market prices for fuels, electricity and GHGallowances. Increasing GHG allowance prices reduce the number of profitable dispatchhours each year and, in some instance, eventually cause the originally-configured plants <strong>to</strong> beshut down before their 41 year operating life is reached. On average in the Base Case, theplants would operate 37.8 years in the absence of <strong>CCS</strong> retrofits. In a second step in theanalysis, the option <strong>to</strong> retrofit the plants <strong>to</strong> current <strong>CCS</strong> technology (and, if available, theadvanced <strong>CCS</strong> technology) is evaluated in each year. If the discounted net present value ofthe plant can be increased by the <strong>CCS</strong> retrofit, then it is assumed <strong>to</strong> take place that year.The summary results of the Monte Carlo simulation are shown in tabular form inExhibit C-7. The first column in the tables show what year the CO 2 restrictions begin. Byassumption, the earliest year is 2016 and the latest year is 2025. The average year CO 2restrictions begin is 2020.6 across all scenarios.A key measure of the economics of each option is the expected value (that is, the averageover all Monte Carlo scenarios) of NPV per MW of original plant capacity. The secondcolumn in Exhibit C-7 shows expected NPV of the original plants assuming they are notretrofitted <strong>to</strong> <strong>CCS</strong>. For this calculation, the plant opera<strong>to</strong>rs are assumed <strong>to</strong> either pay theCO 2 emission costs or cease operating. Because the operating characteristics (heat rates,O&M costs and CO 2 emissions) of the four plant options are nearly identical, the differences23 February 2010 113


