- Page 2 and 3: TABLE OF CONTENTSiii- Maize .......
- Page 4 and 5: TABLE OF CONTENTSv4.12 Mbeya ......
- Page 6 and 7: PREFACEviiPREFACEAt the end of the
- Page 8 and 9: ILLUSTRATIONix2.34 Time Series of B
- Page 10: ILLUSTRATIONxi2.159 Percent of Chic
- Page 13 and 14: EXECUTIVE SUMMARYxivDuring short ra
- Page 15 and 16: EXECUTIVE SUMMARYxvi• IrrigationI
- Page 17 and 18: INTRODUCTION11. INTRODUCTION1.1 Int
- Page 19 and 20: INTRODUCTION3The main topics covere
- Page 21 and 22: INTRODUCTION5Two other instruments
- Page 23 and 24: INTRODUCTION7number of digits for e
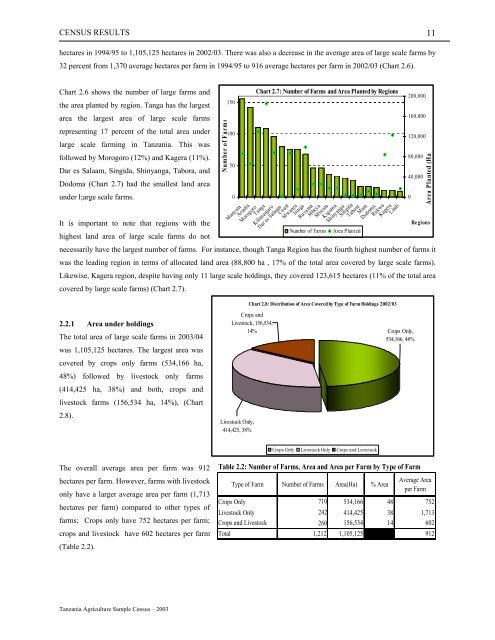
- Page 25: CENSUS RESULTS92.1.1 Total number o
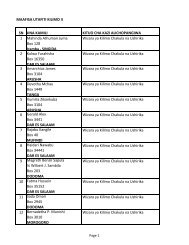
- Page 29 and 30: CENSUS RESULTS132.3.1 Type of land
- Page 31 and 32: CENSUS RESULTS15The average area of
- Page 33 and 34: CENSUS RESULTS17About 68 percent of
- Page 35 and 36: CENSUS RESULTSThe number of large s
- Page 37 and 38: CENSUS RESULTS21census year was 969
- Page 39 and 40: CENSUS RESULTSThe area planted per
- Page 41 and 42: CENSUS RESULTS2.5.7 Oil seed produc
- Page 43 and 44: CENSUS RESULTS272.5.8 Cash crop pro
- Page 45 and 46: CENSUS RESULTS29In terms of area of
- Page 47 and 48: CENSUS RESULTS31Kagera has the larg
- Page 49 and 50: CENSUS RESULTS33Orange production i
- Page 51 and 52: CENSUS RESULTS352.7.3 Methods of ob
- Page 53 and 54: CENSUS RESULTS37On large scale farm
- Page 55 and 56: CENSUS RESULTS392.9.3 Mean Normal D
- Page 57 and 58: CENSUS RESULTS412.11 On Farm Tree P
- Page 59 and 60: CENSUS RESULTS43The number of farms
- Page 61 and 62: CENSUS RESULTS452.14 Crop Extension
- Page 63 and 64: CENSUS RESULTS2.15 Agricultural Imp
- Page 65 and 66: CENSUS RESULTS2.15.2 HarvestersTher
- Page 67 and 68: CENSUS RESULTS51Out of 1,212 large
- Page 69 and 70: CENSUS RESULTS53- Improved Cattle P
- Page 71 and 72: CENSUS RESULTS55The sheep populatio
- Page 73 and 74: CENSUS RESULTS57were kept on only 5
- Page 75 and 76: CENSUS RESULTS593.2.3 Skin and hide
- Page 77 and 78:
CENSUS RESULTS61Out of the total ch
- Page 79 and 80:
CENSUS RESULTS3.4.3 Access to input
- Page 81 and 82:
CENSUS RESULTS65Table 2.22: Number
- Page 83 and 84:
REGIONAL PROFILES674 REGIONAL PROFI
- Page 85 and 86:
REGIONAL PROFILES69Kilimanjaro regi
- Page 87 and 88:
REGIONAL PROFILES71The region has r
- Page 89 and 90:
REGIONAL PROFILES73Lindi has the lo
- Page 91 and 92:
REGIONAL PROFILES75Pwani has the se
- Page 93 and 94:
REGIONAL PROFILES77Mbeya has low nu
- Page 95 and 96:
REGIONAL PROFILES79The region has l
- Page 97 and 98:
REGIONAL PROFILES81Virtually no pad
- Page 99 and 100:
REGIONAL PROFILES83and services exc
- Page 101 and 102:
APPENDIX II 854. APPENDICESAppendix
- Page 103 and 104:
APPENDIX II 873.5 Number of Holding
- Page 105 and 106:
APPENDIX II 8914.2.5 Number of Sogh
- Page 107 and 108:
APPENDIX II 91SHEEP PRODUCTION ....
- Page 109 and 110:
APPENDIX II 93LIVESTOCK EXTENSION..
- Page 111 and 112:
Appendix II 95TYPE OF HOLDINGTanzan
- Page 113 and 114:
Appendix II 971.4 TYPE OF FARM OWNE
- Page 115 and 116:
Appendix II 99RANK OF IMPORTANCE OF
- Page 117 and 118:
Appendix II 1012.3 RANK OF IMPORTAN
- Page 119 and 120:
Appendix II 1032.7 RANK OF IMPORTAN
- Page 121 and 122:
Appendix II 105LAND ACCESS/OWNERSHI
- Page 123 and 124:
Appendix II 1073.2 LAND ACCESS/OWNE
- Page 125 and 126:
Appendix II 1093.4 LAND ACCESS/OWNE
- Page 127 and 128:
Appendix II 111LAND USETanzania Agr
- Page 129 and 130:
Appendix II 113cont….LAND USE: Nu
- Page 131 and 132:
Appendix II 115cont…. LAND USE: N
- Page 133 and 134:
Appendix II 117cont….LAND USE: Nu
- Page 135 and 136:
Appendix II 119cont….LAND USE: Nu
- Page 137 and 138:
Appendix II 121cont...LAND USE: Num
- Page 139 and 140:
Appendix II 123ANNUAL CROPS (VULI S
- Page 141 and 142:
Appendix II 1255.1.2 ANNUAL CROPS (
- Page 143 and 144:
Appendix II 127cont... ANNUAL CROPS
- Page 145 and 146:
Appendix II 129cont…. ANNUAL CROP
- Page 147 and 148:
Appendix II 131cont…. ANNUAL CROP
- Page 149 and 150:
Appendix II 133SECONDARY PRODUCTSTa
- Page 151 and 152:
Appendix II 135AGRO PROCESSINGTanza
- Page 153 and 154:
Appendix II 1378.3 AGRO PROCESSING:
- Page 155 and 156:
Appendix II 139FARM IMPLEMENTS AND
- Page 157 and 158:
Appendix II 141cont….FARM IMPLEME
- Page 159 and 160:
Appendix II 1439.2 FARM IMPLEMENTS
- Page 161 and 162:
Appendix II 145cont...FARM IMPLEMEN
- Page 163 and 164:
Appendix II 147cont...FARM IMPLEMEN
- Page 165 and 166:
Appendix II 149cont….FARM IMPLEME
- Page 167 and 168:
Appendix II 1519.6 FARM IMPLEMENTS
- Page 169 and 170:
Appendix II 153IRRIGATION PRACTICET
- Page 171 and 172:
Appendix II 15510.1.3 IRRIGATION PR
- Page 173 and 174:
Appendix II 15710.3.1 EROSION CONTR
- Page 175 and 176:
Appendix II 15910.4.3 SHADES AND ST
- Page 177 and 178:
Appendix II 16110.5.3 FARM FENCES:
- Page 179 and 180:
Appendix II 163MARKETINGTanzania Ag
- Page 181 and 182:
Appendix II 16514.1.3 MARKETING: Nu
- Page 183 and 184:
Appendix II 16714.2.3 MARKETING: Nu
- Page 185 and 186:
Appendix II 16914.2.7 MARKETING: Nu
- Page 187 and 188:
Appendix II 17114.2.11 MARKETING: N
- Page 189 and 190:
Appendix II 17314.3.1 RANK OF IMPOR
- Page 191 and 192:
Appendix II 17514.3.4 RANK OF IMPOR
- Page 193 and 194:
Appendix II 177SERVICES PROVIDED TO
- Page 195 and 196:
Appendix II 17915.2 SERVICES PROVID
- Page 197 and 198:
Appendix II 18115.3 SERVICES PROVID
- Page 199 and 200:
Appendix II 183RANK OF IMPORTANCE O
- Page 201 and 202:
Appendix II 18516.1.2 RANK OF IMPOR
- Page 203 and 204:
Appendix II 18716.1.4 RANK OF IMPOR
- Page 205 and 206:
Appendix II 18916.2.1 RANK OF IMPOR
- Page 207 and 208:
Appendix II 19116.2.3 RANK OF IMPOR
- Page 209 and 210:
Appendix II 19316.2.5 RANK OF IMPOR
- Page 211 and 212:
Appendix II 195LIVESTOCK NUMBERSTan
- Page 213 and 214:
Appendix II 19718.2 LIVESTOCK NUMBE
- Page 215 and 216:
Appendix II 19918.4 LIVESTOCK NUMBE
- Page 217 and 218:
Appendix II 20118.6.1 LIVESTOCK PRO
- Page 219 and 220:
Appendix II 20318.6.3 LIVESTOCK PRO
- Page 221 and 222:
Appendix II 20518.6.5 LIVESTOCK PRO
- Page 223 and 224:
Appendix II 207LIVESTOCK NUMBERSTan
- Page 225 and 226:
Appendix II 20919.2 LIVESTOCK NUMBE
- Page 227 and 228:
Appendix II 21119.3 LIVESTOCK NUMBE
- Page 229 and 230:
Appendix II 21320.1 Number and Perc
- Page 231 and 232:
Appendix II 21521.2 LIVESTOCK NUMBE
- Page 233 and 234:
Appendix II 217OTHER LIVESTOCKTanza
- Page 235 and 236:
Appendix II 219cont…. OTHER LIVES
- Page 237 and 238:
Appendix II 22123.4 OTHER LIVESTOCK
- Page 239 and 240:
Appendix II 22323.6 OTHER LIVESTOCK
- Page 241 and 242:
Appendix II 225CHICKEN DISEASESTanz
- Page 243 and 244:
Appendix II 22724.2 CHICKEN DISEASE
- Page 245 and 246:
Appendix II 22924.4 CHICKEN DISEASE
- Page 247 and 248:
Appendix II 23124.6 CHICKEN DISEASE
- Page 249 and 250:
Appendix II 233LIVESTOCK PRODUCTSTa
- Page 251 and 252:
Appendix II 235RANK OF CATTLE MARKE
- Page 253 and 254:
Appendix II 23726.4 RANK OF CATTLE
- Page 255 and 256:
Appendix II 23926.8 RANK OF GOATS M
- Page 257 and 258:
Appendix II 24126.12 RANK OF SHEEP
- Page 259 and 260:
Appendix II 24326.16 RANK OF PIGS M
- Page 261 and 262:
Appendix II 24526.20 RANK OF PIGS M
- Page 263 and 264:
Appendix II 24726.24 RANK OF CHICKE
- Page 265 and 266:
Appendix II 249ACCESS TO FUNCTIONAL
- Page 267 and 268:
Appendix II 25127.3 ACCESS TO FUNCT
- Page 269 and 270:
Appendix II 25327.7 ACCESS TO FUNCT
- Page 271 and 272:
Appendix II 25527.11 ACCESS TO FUNC
- Page 273 and 274:
Appendix II 257LIVESTOCK EXTENSIONT
- Page 275 and 276:
Appendix II 25928.3: LIVESTOCK EXTE
- Page 277 and 278:
Appendix II 261FARM EMPLOYMENTTanza
- Page 279 and 280:
Appendix II 263cont….FARM EMPLOYM
- Page 281 and 282:
Appendix II 265cont…. FARM EMPLOY
- Page 283 and 284:
Appendix II 267cont….FARM EMPLOYM
- Page 285 and 286:
Appendix II 269cont….FARM EMPLOYM
- Page 287 and 288:
Appendix II 271cont…. FARM EMPLOY