Large Scale Farm Report - Ministry Of Agriculture, Food and ...
Large Scale Farm Report - Ministry Of Agriculture, Food and ...
Large Scale Farm Report - Ministry Of Agriculture, Food and ...

You also want an ePaper? Increase the reach of your titles
YUMPU automatically turns print PDFs into web optimized ePapers that Google loves.
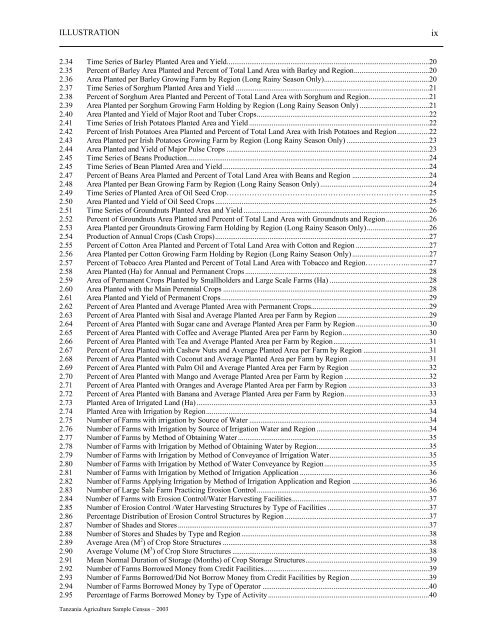
ILLUSTRATIONix2.34 Time Series of Barley Planted Area <strong>and</strong> Yield............................................................................................................202.35 Percent of Barley Area Planted <strong>and</strong> Percent of Total L<strong>and</strong> Area with Barley <strong>and</strong> Region........................................202.36 Area Planted per Barley Growing <strong>Farm</strong> by Region (Long Rainy Season Only)........................................................202.37 Time Series of Sorghum Planted Area <strong>and</strong> Yield .......................................................................................................212.38 Percent of Sorghum Area Planted <strong>and</strong> Percent of Total L<strong>and</strong> Area with Sorghum <strong>and</strong> Region................................212.39 Area Planted per Sorghum Growing <strong>Farm</strong> Holding by Region (Long Rainy Season Only) .....................................212.40 Area Planted <strong>and</strong> Yield of Major Root <strong>and</strong> Tuber Crops............................................................................................222.41 Time Series of Irish Potatoes Planted Area <strong>and</strong> Yield ................................................................................................222.42 Percent of Irish Potatoes Area Planted <strong>and</strong> Percent of Total L<strong>and</strong> Area with Irish Potatoes <strong>and</strong> Region.................222.43 Area Planted per Irish Potatoes Growing <strong>Farm</strong> by Region (Long Rainy Season Only) ............................................232.44 Area Planted <strong>and</strong> Yield of Major Pulse Crops ............................................................................................................232.45 Time Series of Beans Production.................................................................................................................................242.45 Time Series of Bean Planted Area <strong>and</strong> Yield..............................................................................................................242.47 Percent of Beans Area Planted <strong>and</strong> Percent of Total L<strong>and</strong> Area with Beans <strong>and</strong> Region .........................................242.48 Area Planted per Bean Growing <strong>Farm</strong> by Region (Long Rainy Season Only) ..........................................................242.49 Time Series of Planted Area of Oil Seed Crop……………………………………………………………… ..........252.50 Area Planted <strong>and</strong> Yield of Oil Seed Crops ..................................................................................................................252.51 Time Series of Groundnuts Planted Area <strong>and</strong> Yield ...................................................................................................262.52 Percent of Groundnuts Area Planted <strong>and</strong> Percent of Total L<strong>and</strong> Area with Groundnuts <strong>and</strong> Region.......................262.53 Area Planted per Groundnuts Growing <strong>Farm</strong> Holding by Region (Long Rainy Season Only).................................262.54 Production of Annual Crops (Cash Crops)..................................................................................................................272.55 Percent of Cotton Area Planted <strong>and</strong> Percent of Total L<strong>and</strong> Area with Cotton <strong>and</strong> Region .......................................272.56 Area Planted per Cotton Growing <strong>Farm</strong> Holding by Region (Long Rainy Season Only) .........................................272.57 Percent of Tobacco Area Planted <strong>and</strong> Percent of Total L<strong>and</strong> Area with Tobacco <strong>and</strong> Region…………….............272.58 Area Planted (Ha) for Annual <strong>and</strong> Permanent Crops ..................................................................................................282.59 Area of Permanent Crops Planted by Smallholders <strong>and</strong> <strong>Large</strong> <strong>Scale</strong> <strong>Farm</strong>s (Ha) .....................................................282.60 Area Planted with the Main Perennial Crops ..............................................................................................................282.61 Area Planted <strong>and</strong> Yield of Permanent Crops...............................................................................................................292.62 Percent of Area Planted <strong>and</strong> Average Planted Area with Permanent Crops...............................................................292.63 Percent of Area Planted with Sisal <strong>and</strong> Average Planted Area per <strong>Farm</strong> by Region .................................................292.64 Percent of Area Planted with Sugar cane <strong>and</strong> Average Planted Area per <strong>Farm</strong> by Region.......................................302.65 Percent of Area Planted with Coffee <strong>and</strong> Average Planted Area per <strong>Farm</strong> by Region..............................................302.66 Percent of Area Planted with Tea <strong>and</strong> Average Planted Area per <strong>Farm</strong> by Region...................................................312.67 Percent of Area Planted with Cashew Nuts <strong>and</strong> Average Planted Area per <strong>Farm</strong> by Region ...................................312.68 Percent of Area Planted with Coconut <strong>and</strong> Average Planted Area per <strong>Farm</strong> by Region ...........................................312.69 Percent of Area Planted with Palm Oil <strong>and</strong> Average Planted Area per <strong>Farm</strong> by Region ..........................................322.70 Percent of Area Planted with Mango <strong>and</strong> Average Planted Area per <strong>Farm</strong> by Region .............................................322.71 Percent of Area Planted with Oranges <strong>and</strong> Average Planted Area per <strong>Farm</strong> by Region ...........................................332.72 Percent of Area Planted with Banana <strong>and</strong> Average Planted Area per <strong>Farm</strong> by Region.............................................332.73 Planted Area of Irrigated L<strong>and</strong> (Ha) ............................................................................................................................332.74 Planted Area with Irrigation by Region.......................................................................................................................342.75 Number of <strong>Farm</strong>s with irrigation by Source of Water ................................................................................................342.76 Number of <strong>Farm</strong>s with Irrigation by Source of Irrigation Water <strong>and</strong> Region ............................................................342.77 Number of <strong>Farm</strong>s by Method of Obtaining Water ......................................................................................................352.78 Number of <strong>Farm</strong>s with Irrigation by Method of Obtaining Water by Region............................................................352.79 Number of <strong>Farm</strong>s with Irrigation by Method of Conveyance of Irrigation Water.....................................................352.80 Number of <strong>Farm</strong>s with Irrigation by Method of Water Conveyance by Region........................................................352.81 Number of <strong>Farm</strong>s with Irrigation by Method of Irrigation Application .....................................................................362.82 Number of <strong>Farm</strong>s Applying Irrigation by Method of Irrigation Application <strong>and</strong> Region .........................................362.83 Number of <strong>Large</strong> Sale <strong>Farm</strong> Practicing Erosion Control............................................................................................362.84 Number of <strong>Farm</strong>s with Erosion Control/Water Harvesting Facilities.........................................................................372.85 Number of Erosion Control /Water Harvesting Structures by Type of Facilities ......................................................372.86 Percentage Distribution of Erosion Control Structures by Region .............................................................................372.87 Number of Shades <strong>and</strong> Stores ......................................................................................................................................372.88 Number of Stores <strong>and</strong> Shades by Type <strong>and</strong> Region....................................................................................................382.89 Average Area (M 2 ) of Crop Store Structures ..............................................................................................................382.90 Average Volume (M 3 ) of Crop Store Structures .........................................................................................................382.91 Mean Normal Duration of Storage (Months) of Crop Storage Structures..................................................................392.92 Number of <strong>Farm</strong>s Borrowed Money from Credit Facilities........................................................................................392.93 Number of <strong>Farm</strong>s Borrowed/Did Not Borrow Money from Credit Facilities by Region ..........................................392.94 Number of <strong>Farm</strong>s Borrowed Money by Type of Operator .........................................................................................402.95 Percentage of <strong>Farm</strong>s Borrowed Money by Type of Activity......................................................................................40Tanzania <strong>Agriculture</strong> Sample Census – 2003