Large Scale Farm Report - Ministry Of Agriculture, Food and ...
Large Scale Farm Report - Ministry Of Agriculture, Food and ...
Large Scale Farm Report - Ministry Of Agriculture, Food and ...

Create successful ePaper yourself
Turn your PDF publications into a flip-book with our unique Google optimized e-Paper software.
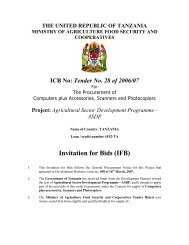
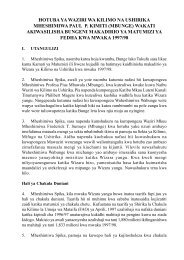
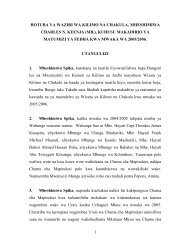
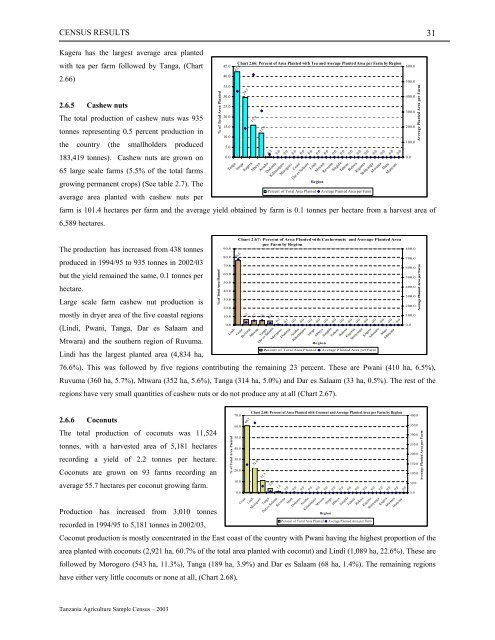
CENSUS RESULTS31Kagera has the largest average area plantedwith tea per farm followed by Tanga, (Chart2.66)% of Total Area Planted45.040.035.030.0Chart 2.66: Percent of Area Planted with Tea <strong>and</strong> Average Planted Area per <strong>Farm</strong> by Region42.329.72.6.5 Cashew nuts25.0300.0The total production of cashew nuts was 935tonnes representing 0.5 percent production in20.015.0200.010.0100.0the country (the smallholders produced5.0183,419 tonnes). Cashew nuts are grown on65 large scale farms (5.5% of the total farms0.00.0growing permanent crops) (See table 2.7). Theaverage area planted with cashew nuts perRegionPercent of Total Area Planted Average Planted Area per <strong>Farm</strong>farm is 101.4 hectares per farm <strong>and</strong> the average yield obtained by farm is 0.1 tonnes per hectare from a harvest area of6,589 hectares.0.20.00.00.00.090.0800.0The production has increased from 438 tonnes80.0700.0produced in 1994/95 to 935 tonnes in 2002/0370.0600.060.0but the yield remained the same, 0.1 tonnes per500.050.0400.0hectare.40.0300.030.0<strong>Large</strong> scale farm cashew nut production is200.020.0mostly in dryer area of the five coastal regions 10.0100.00.00.0(Lindi, Pwani, Tanga, Dar es Salaam <strong>and</strong>Mtwara) <strong>and</strong> the southern region of Ruvuma.RegionPercent of Total Area Planted Average Planted Area per <strong>Farm</strong>Lindi has the largest planted area (4,834 ha,76.6%). This was followed by five regions contributing the remaining 23 percent. These are Pwani (410 ha, 6.5%),Ruvuma (360 ha, 5.7%), Mtwara (352 ha, 5.6%), Tanga (314 ha, 5.0%) <strong>and</strong> Dar es Salaam (33 ha, 0.5%). The rest of theregions have very small quantities of cashew nuts or do not produce any at all (Chart 2.67).15.911.9TangaIringaKageraMbeyaArushaDodomaKilimanjaroMorogoroCoastDar es Salaam76.66.5LindiCoast 5.7Ruvuma 5.6Mtwara 5.0Tanga0.5Dar es Salaam0.1Morogoro0.0Dodoma0.0Arusha0.0Kilimanjaro0.0Iringa0.0Mbeya0.0Singida0.0Tabora0.0Rukwa0.0Kigoma0.0Shinyanga0.0Kagera0.0Mwanza0.0Mara0.0Manyara% of Total Area Planted0.00.00.00.0LindiMtwaraRuvumaSingida0.00.00.00.00.0TaboraRukwaKigomaShinyanga0.00.00.0MwanzaMaraManyaraChart 2.67: Percent of Area Planted with Cashewnuts <strong>and</strong> Average Planted Areaper <strong>Farm</strong> by Region600.0500.0400.0Average Planted Area per <strong>Farm</strong>Average Planted Area per <strong>Farm</strong>2.6.6 CoconutsThe total production of coconuts was 11,524tonnes, with a harvested area of 5,181 hectaresrecording a yield of 2.2 tonnes per hectare.Coconuts are grown on 93 farms recording anaverage 55.7 hectares per coconut growing farm.% of Total Area Planted70.060.050.040.030.020.010.00.060.7Chart 2.68: Percent of Area Planted with Coconut <strong>and</strong> Average Planted Area per <strong>Farm</strong> by RegionProduction has increased from 3,010 tonnesRegionPercent of Total Area Planted Average Planted Area per <strong>Farm</strong>recorded in 1994/95 to 5,181 tonnes in 2002/03,Coconut production is mostly concentrated in the East coast of the country with Pwani having the highest proportion of thearea planted with coconuts (2,921 ha, 60.7% of the total area planted with coconut) <strong>and</strong> Lindi (1,089 ha, 22.6%). These arefollowed by Morogoro (543 ha, 11.3%), Tanga (189 ha, 3.9%) <strong>and</strong> Dar es Salaam (68 ha, 1.4%). The remaining regionshave either very little coconuts or none at all, (Chart 2.68).22.611.33.91.40.0CoastLindiMorogoroTangaDar es Salaam0.00.00.00.00.0RuvumaMaraDodomaArushaKilimanjaroMtwara0.00.00.00.0IringaMbeyaSingidaTabora0.00.00.00.00.00.0RukwaKigomaShinyangaKageraMwanzaManyara400.0350.0300.0250.0200.0150.0100.050.00.0Average Planted Area per <strong>Farm</strong>Tanzania <strong>Agriculture</strong> Sample Census – 2003