Abbott Hospira Plum A Plus and Plum A Plus 3 version 11.6 Infusion ...
Abbott Hospira Plum A Plus and Plum A Plus 3 version 11.6 Infusion ...
Abbott Hospira Plum A Plus and Plum A Plus 3 version 11.6 Infusion ...

Create successful ePaper yourself
Turn your PDF publications into a flip-book with our unique Google optimized e-Paper software.
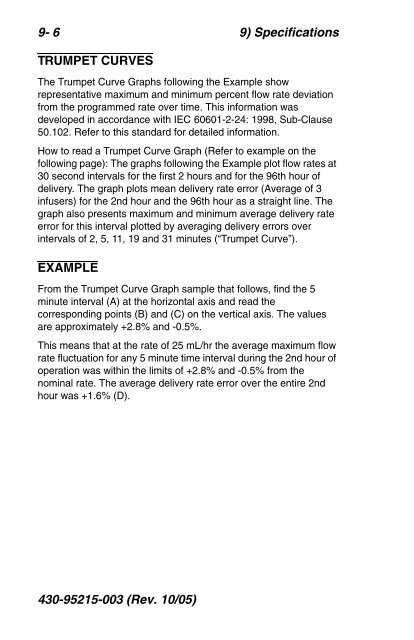
9- 6 9) SpecificationsTRUMPET CURVESThe Trumpet Curve Graphs following the Example showrepresentative maximum <strong>and</strong> minimum percent flow rate deviationfrom the programmed rate over time. This information wasdeveloped in accordance with IEC 60601-2-24: 1998, Sub-Clause50.102. Refer to this st<strong>and</strong>ard for detailed information.How to read a Trumpet Curve Graph (Refer to example on thefollowing page): The graphs following the Example plot flow rates at30 second intervals for the first 2 hours <strong>and</strong> for the 96th hour ofdelivery. The graph plots mean delivery rate error (Average of 3infusers) for the 2nd hour <strong>and</strong> the 96th hour as a straight line. Thegraph also presents maximum <strong>and</strong> minimum average delivery rateerror for this interval plotted by averaging delivery errors overintervals of 2, 5, 11, 19 <strong>and</strong> 31 minutes (“Trumpet Curve”).EXAMPLEFrom the Trumpet Curve Graph sample that follows, find the 5minute interval (A) at the horizontal axis <strong>and</strong> read thecorresponding points (B) <strong>and</strong> (C) on the vertical axis. The valuesare approximately +2.8% <strong>and</strong> -0.5%.This means that at the rate of 25 mL/hr the average maximum flowrate fluctuation for any 5 minute time interval during the 2nd hour ofoperation was within the limits of +2.8% <strong>and</strong> -0.5% from thenominal rate. The average delivery rate error over the entire 2ndhour was +1.6% (D).430-95215-003 (Rev. 10/05)