- Page 2 and 3:
Change HistoryChange HistoryTitle43
- Page 4 and 5:
iiContents3) EQUIPMENT DESCRIPTION
- Page 6 and 7:
ivContents9) SPECIFICATIONS . . . .
- Page 8 and 9:
1- 2 1) Descriptive InformationThe
- Page 10 and 11:
1- 4 1) Descriptive InformationWARN
- Page 12 and 13:
1- 6 1) Descriptive Information1.4
- Page 14 and 15:
1- 8 1) Descriptive Information•
- Page 16 and 17:
1- 10 1) Descriptive InformationThe
- Page 18 and 19:
1- 12 1) Descriptive Informationsig
- Page 20 and 21:
1- 14 1) Descriptive InformationUsi
- Page 22 and 23:
2- 2 2) Principles of OperationPLUM
- Page 24 and 25:
2- 4 2) Principles of OperationTERM
- Page 26 and 27:
2- 6 2) Principles of OperationTERM
- Page 28 and 29:
2- 8 2) Principles of OperationTERM
- Page 30 and 31:
2- 10 2) Principles of OperationTER
- Page 32 and 33:
2- 12 2) Principles of OperationTER
- Page 34 and 35:
3- 2 3) Equipment Description3.1 Op
- Page 36 and 37:
3- 4 3) Equipment DescriptionThe nu
- Page 38 and 39:
3- 6 3) Equipment Description3.3 Re
- Page 40 and 41:
3- 8 3) Equipment Description3.4 Ad
- Page 42 and 43:
3- 10 3) Equipment DescriptionPush
- Page 44 and 45:
3- 12 3) Equipment DescriptionSet u
- Page 46 and 47:
3- 14 3) Equipment DescriptionNOTES
- Page 48 and 49:
4- 2 4) Basic OperationINTERFERENCE
- Page 50 and 51:
4- 4 4) Basic OperationFailure duri
- Page 52 and 53:
4- 6 4) Basic Operation4.3 Simple D
- Page 54 and 55:
4- 8 4) Basic Operation9) Press to
- Page 56 and 57:
4- 10 4) Basic OperationThe followi
- Page 58 and 59:
4- 12 4) Basic OperationThe Deliver
- Page 60 and 61:
4- 14 4) Basic Operation4.6 Concurr
- Page 62 and 63:
4- 16 4) Basic OperationAutomatic C
- Page 64 and 65:
4- 18 4) Basic Operation4.8 Stop an
- Page 66 and 67:
4- 20 4) Basic Operation4.9 Backpri
- Page 68 and 69:
4- 22 4) Basic Operation4) Select
- Page 70 and 71:
5- 2 5) Therapies5.1 Dose Calc (mcg
- Page 72:
5- 4 5) TherapiesThe Program Dose C
- Page 75 and 76:
Plum A+ Infusion Systems 5- 7The Ma
- Page 77 and 78: Plum A+ Infusion Systems 5- 9The Dr
- Page 79 and 80: Plum A+ Infusion Systems 5- 11The n
- Page 81 and 82: Plum A+ Infusion Systems 5- 13Upon
- Page 83 and 84: Plum A+ Infusion Systems 5- 15The s
- Page 85 and 86: Plum A+ Infusion Systems 5- 178) En
- Page 87 and 88: Plum A+ Infusion Systems 5- 19retur
- Page 89 and 90: Plum A+ Infusion Systems 5- 215.4 M
- Page 91 and 92: Plum A+ Infusion Systems 5- 23The S
- Page 93 and 94: Plum A+ Infusion Systems 5- 25NOTE:
- Page 95 and 96: Plum A+ Infusion Systems 5- 27If Ra
- Page 97 and 98: Plum A+ Infusion Systems 6- 16) Add
- Page 99 and 100: Plum A+ Infusion Systems 6- 3Notice
- Page 101 and 102: Plum A+ Infusion Systems 6- 52) Ent
- Page 103 and 104: Plum A+ Infusion Systems 6- 76.4 Po
- Page 105 and 106: Plum A+ Infusion Systems 6- 96.6 Se
- Page 107 and 108: Plum A+ Infusion Systems 6- 119) Wh
- Page 109 and 110: Plum A+ Infusion Systems 6- 1322) S
- Page 111 and 112: Plum A+ Infusion Systems 7- 17) Ala
- Page 113 and 114: Plum A+ Infusion Systems 7- 3GENERA
- Page 115 and 116: Plum A+ Infusion Systems 7- 5LINE A
- Page 117 and 118: Plum A+ Infusion Systems 7- 7LINE B
- Page 119 and 120: Plum A+ Infusion Systems 8- 18) Mai
- Page 121 and 122: Plum A+ Infusion Systems 8- 3To unl
- Page 123 and 124: Plum A+ Infusion Systems 9- 19) Spe
- Page 125 and 126: Plum A+ Infusion Systems 9- 3Concur
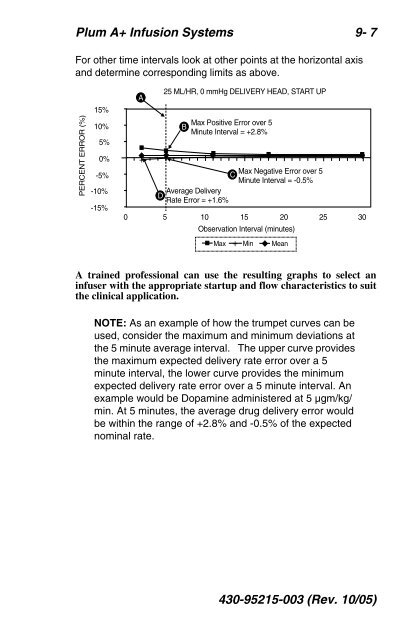
- Page 127: Plum A+ Infusion Systems 9- 5psig f
- Page 131 and 132: Plum A+ Infusion Systems 9- 9Rate (
- Page 133 and 134: Plum A+ Infusion Systems 9- 111 ML/
- Page 135 and 136: Plum A+ Infusion Systems 10- 110) S
- Page 137 and 138: Plum A+ Infusion Systems 11- 111) W
- Page 139 and 140: Plum A+ Infusion Systems 12- 112) D
- Page 141 and 142: Plum A+ Infusion Systems 12- 3DRUG
- Page 143 and 144: Plum A+ Infusion Systems 12- 5DRUG
- Page 145 and 146: Plum A+ Infusion SystemsFor custome