- Page 1 and 2:
ImprovingQuality of Lifefor Older P
- Page 3:
National Council on Ageing and Olde
- Page 6 and 7:
Authors’ AcknowledgementsThe rese
- Page 8 and 9:
ContentsCouncil Comments and Recomm
- Page 10:
6.7 Meaningful Occupation 1296.8 Ch
- Page 14 and 15:
CouncilComments andRecommendations
- Page 16 and 17:
Quality of Life DomainsThe research
- Page 18 and 19:
Meaningful ActivitiesThe research n
- Page 20 and 21:
the research revealed that, in gene
- Page 22 and 23:
The Council accepts that the cultur
- Page 24 and 25:
this regard. The Council believes t
- Page 26 and 27:
ExecutiveSummary
- Page 28 and 29:
MethodologyA mixed method research
- Page 30 and 31:
Long-Stay Facility Survey FindingsT
- Page 32 and 33:
Residents were most positive about
- Page 34 and 35:
Chapter OneIntroduction
- Page 36 and 37:
There is no single definition descr
- Page 38 and 39:
This chapter provides justification
- Page 40 and 41:
Chapter TwoQuality of Careand Quali
- Page 42 and 43:
2.2 Separating Quality of Care and
- Page 44 and 45:
2.3 Policy for Long-Stay Care in Ir
- Page 46 and 47:
2.4 Regulatory StructuresThere are
- Page 48 and 49:
Medical preparations - medication s
- Page 50 and 51:
inspections are mainly concerned wi
- Page 52 and 53:
often not designed to meet the spec
- Page 54 and 55:
Residents who did not want to be in
- Page 56 and 57:
Human resources management standard
- Page 58 and 59:
The Mid-West Standards for Resident
- Page 60 and 61:
process and outcomes of the service
- Page 62 and 63:
2.9 ConclusionQuality of life for o
- Page 64 and 65:
Chapter ThreeThe Interpretationand
- Page 66 and 67:
The difficulty of defining such an
- Page 68 and 69:
Implicit definitions use the broad
- Page 70 and 71:
Human needs may also provide part o
- Page 72 and 73: successfully complete a self-report
- Page 74 and 75: In relation to older people specifi
- Page 76 and 77: The results of this particular stud
- Page 78 and 79: The design of a residential care se
- Page 80 and 81: Chapter FourMethodology
- Page 82 and 83: each method used at the same point
- Page 84 and 85: 4.3.3 Data AnalysisThe transcripts
- Page 86 and 87: Table 4.2: Distribution of question
- Page 88 and 89: 4.4.4 Quantitative Data AnalysisThe
- Page 90 and 91: Anonymity and confidentiality are i
- Page 92 and 93: from stakeholders who attended the
- Page 94 and 95: 4.7 Ethical ClearanceEthical cleara
- Page 96 and 97: Chapter FiveQuality of Lifein Long-
- Page 98 and 99: All participants reported that ther
- Page 100 and 101: Staffing and skill mix: comments fr
- Page 102 and 103: Recruiting and retaining staff: com
- Page 104 and 105: Impact of physical environment on r
- Page 106 and 107: 5.6.2 Social EnvironmentParticipant
- Page 108 and 109: They believed that this problem was
- Page 110 and 111: Participants also discussed at leng
- Page 112 and 113: Chapter SixQuality of Lifein Long-S
- Page 114 and 115: Table 6.1: Type of facilityN %Priva
- Page 116 and 117: Figure 6.2: Age profile of long-sta
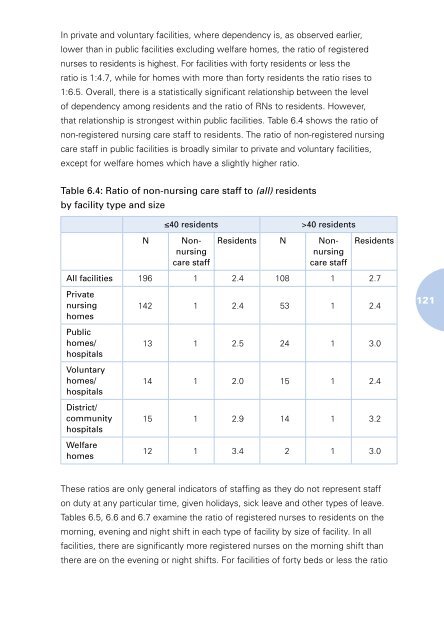
- Page 118 and 119: Figure 6.5 shows the percentages of
- Page 120 and 121: Figure 6.7: Long-stay residents’
- Page 124 and 125: Table 6.6: Ratio of RNs on the even
- Page 126 and 127: Staff turnover investigates the num
- Page 128 and 129: Table 6.10: Therapeutic and other s
- Page 130 and 131: sector and 50 per cent in the volun
- Page 132 and 133: Table 6.13: Number of facilities in
- Page 134 and 135: stay units also allow ambulant, men
- Page 136 and 137: The majority of private and volunta
- Page 138 and 139: Table 6.17: Call bell facilities by
- Page 140 and 141: Chapter SevenDescription ofStudy Si
- Page 142 and 143: others were open and residents’ b
- Page 144 and 145: 7.2.2 StaffingRegistered nurses and
- Page 146 and 147: Some residents were able to leave t
- Page 148 and 149: the day by their bed. In addition,
- Page 150 and 151: equired full assistance with dressi
- Page 152 and 153: Chapter EightCare Environmentand Et
- Page 154 and 155: 8.2 Promoting AutonomyThis category
- Page 156 and 157: Table 8.1: Involvement of residents
- Page 158 and 159: Table 8.2: Maintaining independence
- Page 160 and 161: Focus group participants reported t
- Page 162 and 163: Staff respondents also highlighted
- Page 164 and 165: Therefore, the practice of rosterin
- Page 166 and 167: 8.7 ConclusionThis chapter presente
- Page 168 and 169: Chapter NinePersonal Identity
- Page 170 and 171: Table 9.1: Identity and personalise
- Page 172 and 173:
The real meI’m there in a photogr
- Page 174 and 175:
how important it was that residents
- Page 176 and 177:
Table 9.5: Freedom and constraintsA
- Page 178 and 179:
9.5 PrivacyThe degree of privacy en
- Page 180 and 181:
9.6 Self-RespectAcknowledging resid
- Page 182 and 183:
9.7 ConclusionsThe findings suggest
- Page 184 and 185:
Chapter TenConnectedness,Social Rel
- Page 186 and 187:
10.2 Connectedness, Involvement and
- Page 188 and 189:
A concrete example of the priority
- Page 190 and 191:
Cultural differencesnot an issueI f
- Page 192 and 193:
esidents but reserved the title of
- Page 194 and 195:
Table 10.3: Relationships among res
- Page 196 and 197:
it feel more like visiting somebody
- Page 198 and 199:
Near home(I) was living up the road
- Page 200 and 201:
Chapter ElevenActivitiesand Therapi
- Page 202 and 203:
had a special activities/therapies
- Page 204 and 205:
11.3 Therapeutic ActivityThis categ
- Page 206 and 207:
A few facilities had incorporated o
- Page 208 and 209:
Some facilities organised special t
- Page 210 and 211:
For residents, what appeared to be
- Page 212 and 213:
Chapter TwelveConclusions andRecomm
- Page 214 and 215:
The prevalence of quality deficits
- Page 216 and 217:
attitude to their institutionalisat
- Page 218 and 219:
higher the proportion of care given
- Page 220 and 221:
was that they had a choice. In some
- Page 222 and 223:
The physical environment in some fa
- Page 224 and 225:
activities need to be dynamic and r
- Page 226 and 227:
Older people in residential care mu
- Page 228 and 229:
choice regarding the gender of a ca
- Page 230 and 231:
Residents and their families should
- Page 232 and 233:
References
- Page 234 and 235:
Birren, J.E. and Dieckmann, L., 199
- Page 236 and 237:
Collin, C., Wade, D.T., Davies, S.,
- Page 238 and 239:
Hubbard, G., Downs, M.G. and Tester
- Page 240 and 241:
McCormack, B., 2003. ‘A conceptua
- Page 242 and 243:
Redfern, S., Hannan, S., Norman, I.
- Page 244 and 245:
Appendices
- Page 246 and 247:
Profile of your long-stay facility1
- Page 248 and 249:
6a. Are there any reasons why you w
- Page 250 and 251:
Staff resources10. How many whole-t
- Page 252 and 253:
Services and facilities17. Are any
- Page 254 and 255:
Care process24a. Can long-stay resi
- Page 256 and 257:
32b. If Yes, when can residents smo
- Page 258 and 259:
38a. Was this facility purpose-buil
- Page 260 and 261:
45. Are any of the following provid
- Page 262 and 263:
General atmosphereComment on the ge
- Page 264 and 265:
DomainFeeling caredfor/feelingsecur
- Page 266 and 267:
DomainFeeling caredfor/feelingsecur
- Page 268 and 269:
DomainGeneralCue question/promptsHa
- Page 270 and 271:
DomainCompanionship/relationshipCon
- Page 272 and 273:
DomainRelationship tofamily/friends
- Page 274 and 275:
Terms ofReference
- Page 276 and 277:
c) providing information and advice
- Page 278:
National Council on Ageingand Older