

The Genom of Homo sapiens.pdf
The Genom of Homo sapiens.pdf
The Genom of Homo sapiens.pdf
- TAGS
- homo
- www.yumpu.com

You also want an ePaper? Increase the reach of your titles
YUMPU automatically turns print PDFs into web optimized ePapers that Google loves.
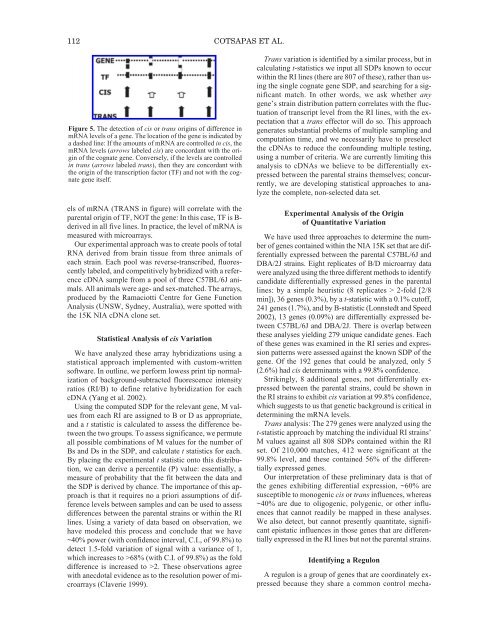
112 COTSAPAS ET AL.Figure 5. <strong>The</strong> detection <strong>of</strong> cis or trans origins <strong>of</strong> difference inmRNA levels <strong>of</strong> a gene. <strong>The</strong> location <strong>of</strong> the gene is indicated bya dashed line: If the amounts <strong>of</strong> mRNA are controlled in cis, themRNA levels (arrows labeled cis) are concordant with the origin<strong>of</strong> the cognate gene. Conversely, if the levels are controlledin trans (arrows labeled trans), then they are concordant withthe origin <strong>of</strong> the transcription factor (TF) and not with the cognategene itself.els <strong>of</strong> mRNA (TRANS in figure) will correlate with theparental origin <strong>of</strong> TF, NOT the gene: In this case, TF is B-derived in all five lines. In practice, the level <strong>of</strong> mRNA ismeasured with microarrays.Our experimental approach was to create pools <strong>of</strong> totalRNA derived from brain tissue from three animals <strong>of</strong>each strain. Each pool was reverse-transcribed, fluorescentlylabeled, and competitively hybridized with a referencecDNA sample from a pool <strong>of</strong> three C57BL/6J animals.All animals were age- and sex-matched. <strong>The</strong> arrays,produced by the Ramaciotti Centre for Gene FunctionAnalysis (UNSW, Sydney, Australia), were spotted withthe 15K NIA cDNA clone set.Statistical Analysis <strong>of</strong> cis VariationWe have analyzed these array hybridizations using astatistical approach implemented with custom-writtens<strong>of</strong>tware. In outline, we perform lowess print tip normalization<strong>of</strong> background-subtracted fluorescence intensityratios (RI/B) to define relative hybridization for eachcDNA (Yang et al. 2002).Using the computed SDP for the relevant gene, M valuesfrom each RI are assigned to B or D as appropriate,and a t statistic is calculated to assess the difference betweenthe two groups. To assess significance, we permuteall possible combinations <strong>of</strong> M values for the number <strong>of</strong>Bs and Ds in the SDP, and calculate t statistics for each.By placing the experimental t statistic onto this distribution,we can derive a percentile (P) value: essentially, ameasure <strong>of</strong> probability that the fit between the data andthe SDP is derived by chance. <strong>The</strong> importance <strong>of</strong> this approachis that it requires no a priori assumptions <strong>of</strong> differencelevels between samples and can be used to assessdifferences between the parental strains or within the RIlines. Using a variety <strong>of</strong> data based on observation, wehave modeled this process and conclude that we have~40% power (with confidence interval, C.I., <strong>of</strong> 99.8%) todetect 1.5-fold variation <strong>of</strong> signal with a variance <strong>of</strong> 1,which increases to >68% (with C.I. <strong>of</strong> 99.8%) as the folddifference is increased to >2. <strong>The</strong>se observations agreewith anecdotal evidence as to the resolution power <strong>of</strong> microarrays(Claverie 1999).Trans variation is identified by a similar process, but incalculating t-statistics we input all SDPs known to occurwithin the RI lines (there are 807 <strong>of</strong> these), rather than usingthe single cognate gene SDP, and searching for a significantmatch. In other words, we ask whether anygene’s strain distribution pattern correlates with the fluctuation<strong>of</strong> transcript level from the RI lines, with the expectationthat a trans effector will do so. This approachgenerates substantial problems <strong>of</strong> multiple sampling andcomputation time, and we necessarily have to preselectthe cDNAs to reduce the confounding multiple testing,using a number <strong>of</strong> criteria. We are currently limiting thisanalysis to cDNAs we believe to be differentially expressedbetween the parental strains themselves; concurrently,we are developing statistical approaches to analyzethe complete, non-selected data set.Experimental Analysis <strong>of</strong> the Origin<strong>of</strong> Quantitative VariationWe have used three approaches to determine the number<strong>of</strong> genes contained within the NIA 15K set that are differentiallyexpressed between the parental C57BL/6J andDBA/2J strains. Eight replicates <strong>of</strong> B/D microarray datawere analyzed using the three different methods to identifycandidate differentially expressed genes in the parentallines: by a simple heuristic (8 replicates > 2-fold [2/8min]), 36 genes (0.3%), by a t-statistic with a 0.1% cut<strong>of</strong>f,241 genes (1.7%), and by B-statistic (Lonnstedt and Speed2002), 13 genes (0.09%) are differentially expressed betweenC57BL/6J and DBA/2J. <strong>The</strong>re is overlap betweenthese analyses yielding 279 unique candidate genes. Each<strong>of</strong> these genes was examined in the RI series and expressionpatterns were assessed against the known SDP <strong>of</strong> thegene. Of the 192 genes that could be analyzed, only 5(2.6%) had cis determinants with a 99.8% confidence.Strikingly, 8 additional genes, not differentially expressedbetween the parental strains, could be shown inthe RI strains to exhibit cis variation at 99.8% confidence,which suggests to us that genetic background is critical indetermining the mRNA levels.Trans analysis: <strong>The</strong> 279 genes were analyzed using thet-statistic approach by matching the individual RI strains’M values against all 808 SDPs contained within the RIset. Of 210,000 matches, 412 were significant at the99.8% level, and these contained 56% <strong>of</strong> the differentiallyexpressed genes.Our interpretation <strong>of</strong> these preliminary data is that <strong>of</strong>the genes exhibiting differential expression, ~60% aresusceptible to monogenic cis or trans influences, whereas~40% are due to oligogenic, polygenic, or other influencesthat cannot readily be mapped in these analyses.We also detect, but cannot presently quantitate, significantepistatic influences in those genes that are differentiallyexpressed in the RI lines but not the parental strains.Identifying a RegulonA regulon is a group <strong>of</strong> genes that are coordinately expressedbecause they share a common control mecha-


