

The Genom of Homo sapiens.pdf
The Genom of Homo sapiens.pdf
The Genom of Homo sapiens.pdf
- TAGS
- homo
- www.yumpu.com

Create successful ePaper yourself
Turn your PDF publications into a flip-book with our unique Google optimized e-Paper software.
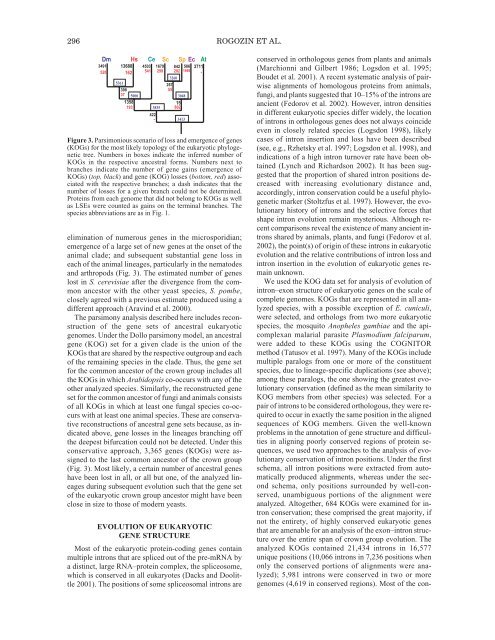
296 ROGOZIN ET AL.Dm Hs Ce Sc Sp Ec At349152053611368816239837135819345035411679299842 586 3711202 1969 -3260267555000 30483835422-15802Figure 3. Parsimonious scenario <strong>of</strong> loss and emergence <strong>of</strong> genes(KOGs) for the most likely topology <strong>of</strong> the eukaryotic phylogenetictree. Numbers in boxes indicate the inferred number <strong>of</strong>KOGs in the respective ancestral forms. Numbers next tobranches indicate the number <strong>of</strong> gene gains (emergence <strong>of</strong>KOGs) (top, black) and gene (KOG) losses (bottom, red) associatedwith the respective branches; a dash indicates that thenumber <strong>of</strong> losses for a given branch could not be determined.Proteins from each genome that did not belong to KOGs as wellas LSEs were counted as gains on the terminal branches. <strong>The</strong>species abbreviations are as in Fig. 1.elimination <strong>of</strong> numerous genes in the microsporidian;emergence <strong>of</strong> a large set <strong>of</strong> new genes at the onset <strong>of</strong> theanimal clade; and subsequent substantial gene loss ineach <strong>of</strong> the animal lineages, particularly in the nematodesand arthropods (Fig. 3). <strong>The</strong> estimated number <strong>of</strong> geneslost in S. cerevisiae after the divergence from the commonancestor with the other yeast species, S. pombe,closely agreed with a previous estimate produced using adifferent approach (Aravind et al. 2000).<strong>The</strong> parsimony analysis described here includes reconstruction<strong>of</strong> the gene sets <strong>of</strong> ancestral eukaryoticgenomes. Under the Dollo parsimony model, an ancestralgene (KOG) set for a given clade is the union <strong>of</strong> theKOGs that are shared by the respective outgroup and each<strong>of</strong> the remaining species in the clade. Thus, the gene setfor the common ancestor <strong>of</strong> the crown group includes allthe KOGs in which Arabidopsis co-occurs with any <strong>of</strong> theother analyzed species. Similarly, the reconstructed geneset for the common ancestor <strong>of</strong> fungi and animals consists<strong>of</strong> all KOGs in which at least one fungal species co-occurswith at least one animal species. <strong>The</strong>se are conservativereconstructions <strong>of</strong> ancestral gene sets because, as indicatedabove, gene losses in the lineages branching <strong>of</strong>fthe deepest bifurcation could not be detected. Under thisconservative approach, 3,365 genes (KOGs) were assignedto the last common ancestor <strong>of</strong> the crown group(Fig. 3). Most likely, a certain number <strong>of</strong> ancestral geneshave been lost in all, or all but one, <strong>of</strong> the analyzed lineagesduring subsequent evolution such that the gene set<strong>of</strong> the eukaryotic crown group ancestor might have beenclose in size to those <strong>of</strong> modern yeasts.EVOLUTION OF EUKARYOTICGENE STRUCTUREMost <strong>of</strong> the eukaryotic protein-coding genes containmultiple introns that are spliced out <strong>of</strong> the pre-mRNA bya distinct, large RNA–protein complex, the spliceosome,which is conserved in all eukaryotes (Dacks and Doolittle2001). <strong>The</strong> positions <strong>of</strong> some spliceosomal introns are3413conserved in orthologous genes from plants and animals(Marchionni and Gilbert 1986; Logsdon et al. 1995;Boudet et al. 2001). A recent systematic analysis <strong>of</strong> pairwisealignments <strong>of</strong> homologous proteins from animals,fungi, and plants suggested that 10–15% <strong>of</strong> the introns areancient (Fedorov et al. 2002). However, intron densitiesin different eukaryotic species differ widely, the location<strong>of</strong> introns in orthologous genes does not always coincideeven in closely related species (Logsdon 1998), likelycases <strong>of</strong> intron insertion and loss have been described(see, e.g., Rzhetsky et al. 1997; Logsdon et al. 1998), andindications <strong>of</strong> a high intron turnover rate have been obtained(Lynch and Richardson 2002). It has been suggestedthat the proportion <strong>of</strong> shared intron positions decreasedwith increasing evolutionary distance and,accordingly, intron conservation could be a useful phylogeneticmarker (Stoltzfus et al. 1997). However, the evolutionaryhistory <strong>of</strong> introns and the selective forces thatshape intron evolution remain mysterious. Although recentcomparisons reveal the existence <strong>of</strong> many ancient intronsshared by animals, plants, and fungi (Fedorov et al.2002), the point(s) <strong>of</strong> origin <strong>of</strong> these introns in eukaryoticevolution and the relative contributions <strong>of</strong> intron loss andintron insertion in the evolution <strong>of</strong> eukaryotic genes remainunknown.We used the KOG data set for analysis <strong>of</strong> evolution <strong>of</strong>intron–exon structure <strong>of</strong> eukaryotic genes on the scale <strong>of</strong>complete genomes. KOGs that are represented in all analyzedspecies, with a possible exception <strong>of</strong> E. cuniculi,were selected, and orthologs from two more eukaryoticspecies, the mosquito Anopheles gambiae and the apicomplexanmalarial parasite Plasmodium falciparum,were added to these KOGs using the COGNITORmethod (Tatusov et al. 1997). Many <strong>of</strong> the KOGs includemultiple paralogs from one or more <strong>of</strong> the constituentspecies, due to lineage-specific duplications (see above);among these paralogs, the one showing the greatest evolutionaryconservation (defined as the mean similarity toKOG members from other species) was selected. For apair <strong>of</strong> introns to be considered orthologous, they were requiredto occur in exactly the same position in the alignedsequences <strong>of</strong> KOG members. Given the well-knownproblems in the annotation <strong>of</strong> gene structure and difficultiesin aligning poorly conserved regions <strong>of</strong> protein sequences,we used two approaches to the analysis <strong>of</strong> evolutionaryconservation <strong>of</strong> intron positions. Under the firstschema, all intron positions were extracted from automaticallyproduced alignments, whereas under the secondschema, only positions surrounded by well-conserved,unambiguous portions <strong>of</strong> the alignment wereanalyzed. Altogether, 684 KOGs were examined for intronconservation; these comprised the great majority, ifnot the entirety, <strong>of</strong> highly conserved eukaryotic genesthat are amenable for an analysis <strong>of</strong> the exon–intron structureover the entire span <strong>of</strong> crown group evolution. <strong>The</strong>analyzed KOGs contained 21,434 introns in 16,577unique positions (10,066 introns in 7,236 positions whenonly the conserved portions <strong>of</strong> alignments were analyzed);5,981 introns were conserved in two or moregenomes (4,619 in conserved regions). Most <strong>of</strong> the con-


