

The Genom of Homo sapiens.pdf
The Genom of Homo sapiens.pdf
The Genom of Homo sapiens.pdf
- TAGS
- homo
- www.yumpu.com

You also want an ePaper? Increase the reach of your titles
YUMPU automatically turns print PDFs into web optimized ePapers that Google loves.
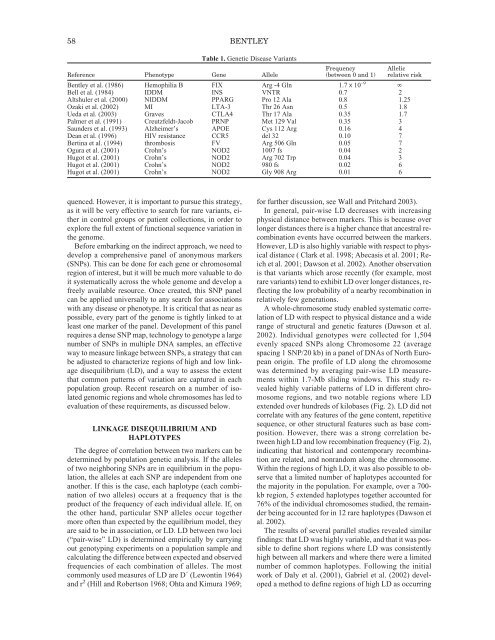
58 BENTLEYTable 1. Genetic Disease VariantsFrequencyAllelicReference Phenotype Gene Allele (between 0 and 1) relative riskBentley et al. (1986) Hemophilia B FIX Arg -4 Gln 1.7 x 10 –9 ∞Bell et al. (1984) IDDM INS VNTR 0.7 2Altshuler et al. (2000) NIDDM PPARG Pro 12 Ala 0.8 1.25Ozaki et al. (2002) MI LTA-3 Thr 26 Asn 0.5 1.8Ueda et al. (2003) Graves CTLA4 Thr 17 Ala 0.35 1.7Palmer et al. (1991) Creutzfeldt-Jacob PRNP Met 129 Val 0.35 3Saunders et al. (1993) Alzheimer’s APOE Cys 112 Arg 0.16 4Dean et al. (1996) HIV resistance CCR5 del 32 0.10 7Bertina et al. (1994) thrombosis FV Arg 506 Gln 0.05 7Ogura et al. (2001) Crohn’s NOD2 1007 fs 0.04 2Hugot et al. (2001) Crohn’s NOD2 Arg 702 Trp 0.04 3Hugot et al. (2001) Crohn’s NOD2 980 fs 0.02 6Hugot et al. (2001) Crohn’s NOD2 Gly 908 Arg 0.01 6quenced. However, it is important to pursue this strategy,as it will be very effective to search for rare variants, eitherin control groups or patient collections, in order toexplore the full extent <strong>of</strong> functional sequence variation inthe genome.Before embarking on the indirect approach, we need todevelop a comprehensive panel <strong>of</strong> anonymous markers(SNPs). This can be done for each gene or chromosomalregion <strong>of</strong> interest, but it will be much more valuable to doit systematically across the whole genome and develop afreely available resource. Once created, this SNP panelcan be applied universally to any search for associationswith any disease or phenotype. It is critical that as near aspossible, every part <strong>of</strong> the genome is tightly linked to atleast one marker <strong>of</strong> the panel. Development <strong>of</strong> this panelrequires a dense SNP map, technology to genotype a largenumber <strong>of</strong> SNPs in multiple DNA samples, an effectiveway to measure linkage between SNPs, a strategy that canbe adjusted to characterize regions <strong>of</strong> high and low linkagedisequilibrium (LD), and a way to assess the extentthat common patterns <strong>of</strong> variation are captured in eachpopulation group. Recent research on a number <strong>of</strong> isolatedgenomic regions and whole chromosomes has led toevaluation <strong>of</strong> these requirements, as discussed below.LINKAGE DISEQUILIBRIUM ANDHAPLOTYPES<strong>The</strong> degree <strong>of</strong> correlation between two markers can bedetermined by population genetic analysis. If the alleles<strong>of</strong> two neighboring SNPs are in equilibrium in the population,the alleles at each SNP are independent from oneanother. If this is the case, each haplotype (each combination<strong>of</strong> two alleles) occurs at a frequency that is theproduct <strong>of</strong> the frequency <strong>of</strong> each individual allele. If, onthe other hand, particular SNP alleles occur togethermore <strong>of</strong>ten than expected by the equilibrium model, theyare said to be in association, or LD. LD between two loci(“pair-wise” LD) is determined empirically by carryingout genotyping experiments on a population sample andcalculating the difference between expected and observedfrequencies <strong>of</strong> each combination <strong>of</strong> alleles. <strong>The</strong> mostcommonly used measures <strong>of</strong> LD are D´ (Lewontin 1964)and r 2 (Hill and Robertson 1968; Ohta and Kimura 1969;for further discussion, see Wall and Pritchard 2003).In general, pair-wise LD decreases with increasingphysical distance between markers. This is because overlonger distances there is a higher chance that ancestral recombinationevents have occurred between the markers.However, LD is also highly variable with respect to physicaldistance ( Clark et al. 1998; Abecasis et al. 2001; Reichet al. 2001; Dawson et al. 2002). Another observationis that variants which arose recently (for example, mostrare variants) tend to exhibit LD over longer distances, reflectingthe low probability <strong>of</strong> a nearby recombination inrelatively few generations.A whole-chromosome study enabled systematic correlation<strong>of</strong> LD with respect to physical distance and a widerange <strong>of</strong> structural and genetic features (Dawson et al.2002). Individual genotypes were collected for 1,504evenly spaced SNPs along Chromosome 22 (averagespacing 1 SNP/20 kb) in a panel <strong>of</strong> DNAs <strong>of</strong> North Europeanorigin. <strong>The</strong> pr<strong>of</strong>ile <strong>of</strong> LD along the chromosomewas determined by averaging pair-wise LD measurementswithin 1.7-Mb sliding windows. This study revealedhighly variable patterns <strong>of</strong> LD in different chromosomeregions, and two notable regions where LDextended over hundreds <strong>of</strong> kilobases (Fig. 2). LD did notcorrelate with any features <strong>of</strong> the gene content, repetitivesequence, or other structural features such as base composition.However, there was a strong correlation betweenhigh LD and low recombination frequency (Fig. 2),indicating that historical and contemporary recombinationare related, and nonrandom along the chromosome.Within the regions <strong>of</strong> high LD, it was also possible to observethat a limited number <strong>of</strong> haplotypes accounted forthe majority in the population. For example, over a 700-kb region, 5 extended haplotypes together accounted for76% <strong>of</strong> the individual chromosomes studied, the remainderbeing accounted for in 12 rare haplotypes (Dawson etal. 2002).<strong>The</strong> results <strong>of</strong> several parallel studies revealed similarfindings: that LD was highly variable, and that it was possibleto define short regions where LD was consistentlyhigh between all markers and where there were a limitednumber <strong>of</strong> common haplotypes. Following the initialwork <strong>of</strong> Daly et al. (2001), Gabriel et al. (2002) developeda method to define regions <strong>of</strong> high LD as occurring


