

The Genom of Homo sapiens.pdf
The Genom of Homo sapiens.pdf
The Genom of Homo sapiens.pdf
- TAGS
- homo
- www.yumpu.com

Create successful ePaper yourself
Turn your PDF publications into a flip-book with our unique Google optimized e-Paper software.
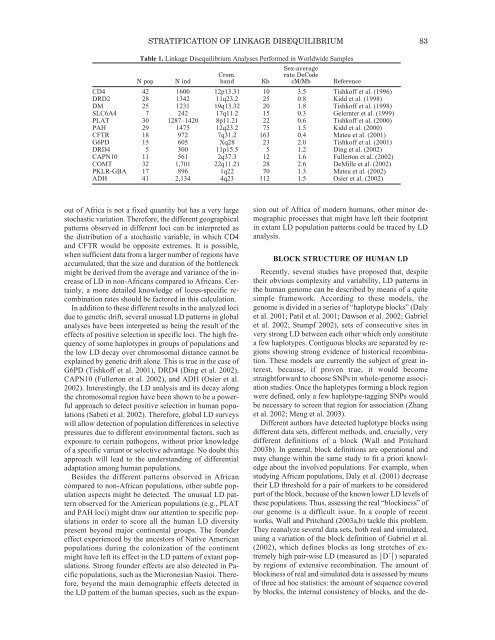
STRATIFICATION OF LINKAGE DISEQUILIBRIUM 83Table 1. Linkage Disequilibrium Analyses Performed in Worldwide SamplesSex-averageCrom.rate DeCodeN pop N ind band Kb cM/Mb ReferenceCD4 42 1600 12p13.31 10 3.5 Tishk<strong>of</strong>f et al. (1996)DRD2 28 1342 11q23.2 25 0.8 Kidd et al. (1998)DM 25 1231 19q13.32 20 1.8 Tishk<strong>of</strong>f et al. (1998)SLC6A4 7 242 17q11.2 15 0.3 Gelernter et al. (1999)PLAT 30 1287–1420 8p11.21 22 0.6 Tishk<strong>of</strong>f et al. (2000)PAH 29 1475 12q23.2 75 1.5 Kidd et al. (2000)CFTR 18 972 7q31.2 163 0.4 Mateu et al. (2001)G6PD 15 605 Xq28 23 2.0 Tishk<strong>of</strong>f et al. (2001)DRD4 5 300 11p15.5 5 1.2 Ding et al. (2002)CAPN10 11 561 2q37.3 12 1.6 Fullerton et al. (2002)COMT 32 1,701 22q11.21 28 2.6 DeMille et al. (2002)PKLR-GBA 17 896 1q22 70 1.3 Mateu et al. (2002)ADH 41 2,134 4q23 112 1.5 Osier et al. (2002)out <strong>of</strong> Africa is not a fixed quantity but has a very largestochastic variation. <strong>The</strong>refore, the different geographicalpatterns observed in different loci can be interpreted asthe distribution <strong>of</strong> a stochastic variable, in which CD4and CFTR would be opposite extremes. It is possible,when sufficient data from a larger number <strong>of</strong> regions haveaccumulated, that the size and duration <strong>of</strong> the bottleneckmight be derived from the average and variance <strong>of</strong> the increase<strong>of</strong> LD in non-Africans compared to Africans. Certainly,a more detailed knowledge <strong>of</strong> locus-specific recombinationrates should be factored in this calculation.In addition to these different results in the analyzed locidue to genetic drift, several unusual LD patterns in globalanalyses have been interpreted as being the result <strong>of</strong> theeffects <strong>of</strong> positive selection in specific loci. <strong>The</strong> high frequency<strong>of</strong> some haplotypes in groups <strong>of</strong> populations andthe low LD decay over chromosomal distance cannot beexplained by genetic drift alone. This is true in the case <strong>of</strong>G6PD (Tishk<strong>of</strong>f et al. 2001), DRD4 (Ding et al. 2002),CAPN10 (Fullerton et al. 2002), and ADH (Osier et al.2002). Interestingly, the LD analysis and its decay alongthe chromosomal region have been shown to be a powerfulapproach to detect positive selection in human populations(Sabeti et al. 2002). <strong>The</strong>refore, global LD surveyswill allow detection <strong>of</strong> population differences in selectivepressures due to different environmental factors, such asexposure to certain pathogens, without prior knowledge<strong>of</strong> a specific variant or selective advantage. No doubt thisapproach will lead to the understanding <strong>of</strong> differentialadaptation among human populations.Besides the different patterns observed in Africancompared to non-African populations, other subtle populationaspects might be detected. <strong>The</strong> unusual LD patternobserved for the American populations (e.g., PLATand PAH loci) might draw our attention to specific populationsin order to score all the human LD diversitypresent beyond major continental groups. <strong>The</strong> foundereffect experienced by the ancestors <strong>of</strong> Native Americanpopulations during the colonization <strong>of</strong> the continentmight have left its effect in the LD pattern <strong>of</strong> extant populations.Strong founder effects are also detected in Pacificpopulations, such as the Micronesian Nasioi. <strong>The</strong>refore,beyond the main demographic effects detected inthe LD pattern <strong>of</strong> the human species, such as the expansionout <strong>of</strong> Africa <strong>of</strong> modern humans, other minor demographicprocesses that might have left their footprintin extant LD population patterns could be traced by LDanalysis.BLOCK STRUCTURE OF HUMAN LDRecently, several studies have proposed that, despitetheir obvious complexity and variability, LD patterns inthe human genome can be described by means <strong>of</strong> a quitesimple framework. According to these models, thegenome is divided in a series <strong>of</strong> “haplotype blocks” (Dalyet al. 2001; Patil et al. 2001; Dawson et al. 2002; Gabrielet al. 2002; Stumpf 2002), sets <strong>of</strong> consecutive sites invery strong LD between each other which only constitutea few haplotypes. Contiguous blocks are separated by regionsshowing strong evidence <strong>of</strong> historical recombination.<strong>The</strong>se models are currently the subject <strong>of</strong> great interest,because, if proven true, it would becomestraightforward to choose SNPs in whole-genome associationstudies. Once the haplotypes forming a block regionwere defined, only a few haplotype-tagging SNPs wouldbe necessary to screen that region for association (Zhanget al. 2002; Meng et al. 2003).Different authors have detected haplotype blocks usingdifferent data sets, different methods, and, crucially, verydifferent definitions <strong>of</strong> a block (Wall and Pritchard2003b). In general, block definitions are operational andmay change within the same study to fit a priori knowledgeabout the involved populations. For example, whenstudying African populations, Daly et al. (2001) decreasetheir LD threshold for a pair <strong>of</strong> markers to be consideredpart <strong>of</strong> the block, because <strong>of</strong> the known lower LD levels <strong>of</strong>these populations. Thus, assessing the real “blockiness” <strong>of</strong>our genome is a difficult issue. In a couple <strong>of</strong> recentworks, Wall and Pritchard (2003a,b) tackle this problem.<strong>The</strong>y reanalyze several data sets, both real and simulated,using a variation <strong>of</strong> the block definition <strong>of</strong> Gabriel et al.(2002), which defines blocks as long stretches <strong>of</strong> extremelyhigh pair-wise LD (measured as ⎪D´⎪) separatedby regions <strong>of</strong> extensive recombination. <strong>The</strong> amount <strong>of</strong>blockiness <strong>of</strong> real and simulated data is assessed by means<strong>of</strong> three ad hoc statistics: the amount <strong>of</strong> sequence coveredby blocks, the internal consistency <strong>of</strong> blocks, and the de-


