

The Genom of Homo sapiens.pdf
The Genom of Homo sapiens.pdf
The Genom of Homo sapiens.pdf
- TAGS
- homo
- www.yumpu.com

Create successful ePaper yourself
Turn your PDF publications into a flip-book with our unique Google optimized e-Paper software.
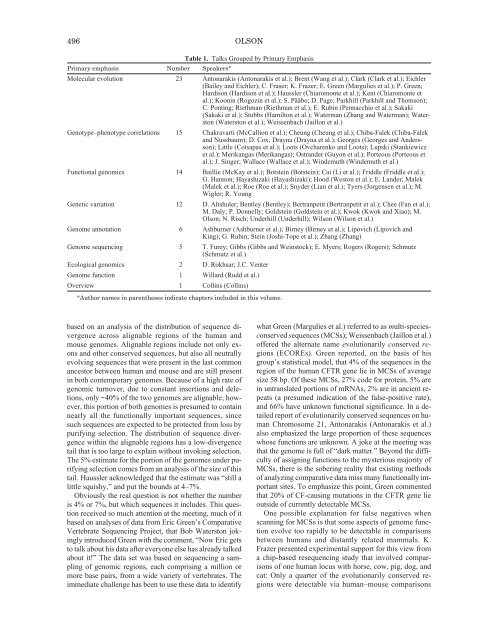
496 OLSONTable 1. Talks Grouped by Primary EmphasisPrimary emphasis Number Speakers*Molecular evolution 23 Antonarakis (Antonarakis et al.); Brent (Wang et al.); Clark (Clark et al.); Eichler(Bailey and Eichler); C. Fraser; K. Frazer; E. Green (Margulies et al.); P. Green;Hardison (Hardison et al.); Haussler (Chiaromonte et al.); Kent (Chiaromonte etal.); Koonin (Rogozin et al.); S. Pääbo; D. Page; Parkhill (Parkhill and Thomson);C. Ponting; Riethman (Riethman et al.); E. Rubin (Pennacchio et al.); Sakaki(Sakaki et al.); Stubbs (Hamilton et al.); Waterman (Zhang and Waterman); Waterston(Waterston et al.); Weissenbach (Jaillon et al.)Genotype–phenotype correlations 15 Chakravarti (McCallion et al.); Cheung (Cheung et al.); Chiba-Falek (Chiba-Falekand Nussbaum); D. Cox; Drayna (Drayna et al.); Georges (Georges and Andersson);Little (Cotsapas et al.); Loots (Ovcharenko and Loots); Lupski (Stankiewiczet al.); Merikangas (Merikangas); Ostrander (Guyon et al.); Porteous (Porteous etal.); J. Singer; Wallace (Wallace et al.); Windemuth (Windemuth et al.)Functional genomics 14 Baillie (McKay et al.); Botstein (Botstein); Cai (Li et al.); Friddle (Friddle et al.);G. Hannon; Hayashizaki (Hayashizaki); Hood (Weston et al.); E. Lander; Malek(Malek et al.); Roe (Roe et al.); Snyder (Lian et al.); Tyers (Jorgensen et al.); M.Wigler; R. YoungGenetic variation 12 D. Altshuler; Bentley (Bentley); Bertranpetit (Bertranpetit et al.); Chee (Fan et al.);M. Daly; P. Donnelly; Goldstein (Goldstein et al.); Kwok (Kwok and Xiao); M.Olson; N. Risch; Underhill (Underhill); Wilson (Wilson et al.)<strong>Genom</strong>e annotation 6 Ashburner (Ashburner et al.); Birney (Birney et al.); Lipovich (Lipovich andKing); G. Rubin; Stein (Joshi-Tope et al.); Zhang (Zhang)<strong>Genom</strong>e sequencing 5 T. Furey; Gibbs (Gibbs and Weinstock); E. Myers; Rogers (Rogers); Schmutz(Schmutz et al.)Ecological genomics 2 D. Rokhsar; J.C. Venter<strong>Genom</strong>e function 1 Willard (Rudd et al.)Overview 1 Collins (Collins)*Author names in parentheses indicate chapters included in this volume.based on an analysis <strong>of</strong> the distribution <strong>of</strong> sequence divergenceacross alignable regions <strong>of</strong> the human andmouse genomes. Alignable regions include not only exonsand other conserved sequences, but also all neutrallyevolving sequences that were present in the last commonancestor between human and mouse and are still presentin both contemporary genomes. Because <strong>of</strong> a high rate <strong>of</strong>genomic turnover, due to constant insertions and deletions,only ~40% <strong>of</strong> the two genomes are alignable; however,this portion <strong>of</strong> both genomes is presumed to containnearly all the functionally important sequences, sincesuch sequences are expected to be protected from loss bypurifying selection. <strong>The</strong> distribution <strong>of</strong> sequence divergencewithin the alignable regions has a low-divergencetail that is too large to explain without invoking selection.<strong>The</strong> 5% estimate for the portion <strong>of</strong> the genomes under purifyingselection comes from an analysis <strong>of</strong> the size <strong>of</strong> thistail. Haussler acknowledged that the estimate was “still alittle squishy,” and put the bounds at 4–7%.Obviously the real question is not whether the numberis 4% or 7%, but which sequences it includes. This questionreceived so much attention at the meeting, much <strong>of</strong> itbased on analyses <strong>of</strong> data from Eric Green’s ComparativeVertebrate Sequencing Project, that Bob Waterston jokinglyintroduced Green with the comment, “Now Eric getsto talk about his data after everyone else has already talkedabout it!” <strong>The</strong> data set was based on sequencing a sampling<strong>of</strong> genomic regions, each comprising a million ormore base pairs, from a wide variety <strong>of</strong> vertebrates. <strong>The</strong>immediate challenge has been to use these data to identifywhat Green (Margulies et al.) referred to as multi-speciesconservedsequences (MCSs); Weissenbach (Jaillon et al.)<strong>of</strong>fered the alternate name evolutionarily conserved regions(ECOREs). Green reported, on the basis <strong>of</strong> hisgroup’s statistical model, that 4% <strong>of</strong> the sequences in theregion <strong>of</strong> the human CFTR gene lie in MCSs <strong>of</strong> averagesize 58 bp. Of these MCSs, 27% code for protein, 5% arein untranslated portions <strong>of</strong> mRNAs, 2% are in ancient repeats(a presumed indication <strong>of</strong> the false-positive rate),and 66% have unknown functional significance. In a detailedreport <strong>of</strong> evolutionarily conserved sequences on humanChromosome 21, Antonarakis (Antonarakis et al.)also emphasized the large proportion <strong>of</strong> these sequenceswhose functions are unknown. A joke at the meeting wasthat the genome is full <strong>of</strong> “dark matter.” Beyond the difficulty<strong>of</strong> assigning functions to the mysterious majority <strong>of</strong>MCSs, there is the sobering reality that existing methods<strong>of</strong> analyzing comparative data miss many functionally importantsites. To emphasize this point, Green commentedthat 20% <strong>of</strong> CF-causing mutations in the CFTR gene lieoutside <strong>of</strong> currently detectable MCSs.One possible explanation for false negatives whenscanning for MCSs is that some aspects <strong>of</strong> genome functionevolve too rapidly to be detectable in comparisonsbetween humans and distantly related mammals. K.Frazer presented experimental support for this view froma chip-based resequencing study that involved comparisons<strong>of</strong> one human locus with horse, cow, pig, dog, andcat: Only a quarter <strong>of</strong> the evolutionarily conserved regionswere detectable via human–mouse comparisons


