

The Genom of Homo sapiens.pdf
The Genom of Homo sapiens.pdf
The Genom of Homo sapiens.pdf
- TAGS
- homo
- www.yumpu.com

Create successful ePaper yourself
Turn your PDF publications into a flip-book with our unique Google optimized e-Paper software.
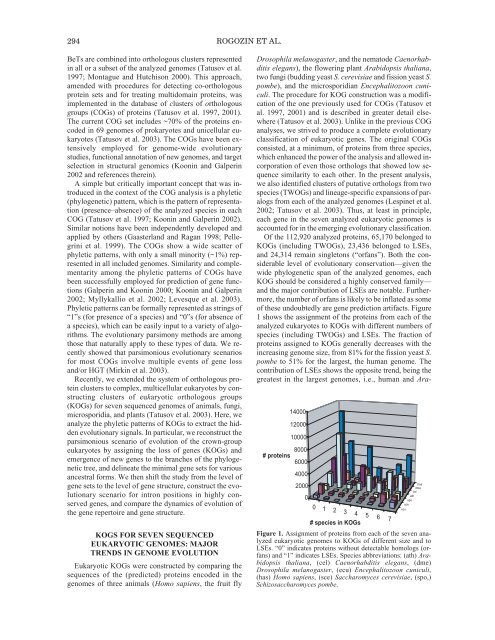
294 ROGOZIN ET AL.BeTs are combined into orthologous clusters representedin all or a subset <strong>of</strong> the analyzed genomes (Tatusov et al.1997; Montague and Hutchison 2000). This approach,amended with procedures for detecting co-orthologousprotein sets and for treating multidomain proteins, wasimplemented in the database <strong>of</strong> clusters <strong>of</strong> orthologousgroups (COGs) <strong>of</strong> proteins (Tatusov et al. 1997, 2001).<strong>The</strong> current COG set includes ~70% <strong>of</strong> the proteins encodedin 69 genomes <strong>of</strong> prokaryotes and unicellular eukaryotes(Tatusov et al. 2003). <strong>The</strong> COGs have been extensivelyemployed for genome-wide evolutionarystudies, functional annotation <strong>of</strong> new genomes, and targetselection in structural genomics (Koonin and Galperin2002 and references therein).A simple but critically important concept that was introducedin the context <strong>of</strong> the COG analysis is a phyletic(phylogenetic) pattern, which is the pattern <strong>of</strong> representation(presence–absence) <strong>of</strong> the analyzed species in eachCOG (Tatusov et al. 1997; Koonin and Galperin 2002).Similar notions have been independently developed andapplied by others (Gaasterland and Ragan 1998; Pellegriniet al. 1999). <strong>The</strong> COGs show a wide scatter <strong>of</strong>phyletic patterns, with only a small minority (~1%) representedin all included genomes. Similarity and complementarityamong the phyletic patterns <strong>of</strong> COGs havebeen successfully employed for prediction <strong>of</strong> gene functions(Galperin and Koonin 2000; Koonin and Galperin2002; Myllykallio et al. 2002; Levesque et al. 2003).Phyletic patterns can be formally represented as strings <strong>of</strong>“1”s (for presence <strong>of</strong> a species) and “0”s (for absence <strong>of</strong>a species), which can be easily input to a variety <strong>of</strong> algorithms.<strong>The</strong> evolutionary parsimony methods are amongthose that naturally apply to these types <strong>of</strong> data. We recentlyshowed that parsimonious evolutionary scenariosfor most COGs involve multiple events <strong>of</strong> gene lossand/or HGT (Mirkin et al. 2003).Recently, we extended the system <strong>of</strong> orthologous proteinclusters to complex, multicellular eukaryotes by constructingclusters <strong>of</strong> eukaryotic orthologous groups(KOGs) for seven sequenced genomes <strong>of</strong> animals, fungi,microsporidia, and plants (Tatusov et al. 2003). Here, weanalyze the phyletic patterns <strong>of</strong> KOGs to extract the hiddenevolutionary signals. In particular, we reconstruct theparsimonious scenario <strong>of</strong> evolution <strong>of</strong> the crown-groupeukaryotes by assigning the loss <strong>of</strong> genes (KOGs) andemergence <strong>of</strong> new genes to the branches <strong>of</strong> the phylogenetictree, and delineate the minimal gene sets for variousancestral forms. We then shift the study from the level <strong>of</strong>gene sets to the level <strong>of</strong> gene structure, construct the evolutionaryscenario for intron positions in highly conservedgenes, and compare the dynamics <strong>of</strong> evolution <strong>of</strong>the gene repertoire and gene structure.KOGS FOR SEVEN SEQUENCEDEUKARYOTIC GENOMES: MAJORTRENDS IN GENOME EVOLUTIONEukaryotic KOGs were constructed by comparing thesequences <strong>of</strong> the (predicted) proteins encoded in thegenomes <strong>of</strong> three animals (<strong>Homo</strong> <strong>sapiens</strong>, the fruit flyDrosophila melanogaster, and the nematode Caenorhabditiselegans), the flowering plant Arabidopsis thaliana,two fungi (budding yeast S. cerevisiae and fission yeast S.pombe), and the microsporidian Encephalitozoon cuniculi.<strong>The</strong> procedure for KOG construction was a modification<strong>of</strong> the one previously used for COGs (Tatusov etal. 1997, 2001) and is described in greater detail elsewhere(Tatusov et al. 2003). Unlike in the previous COGanalyses, we strived to produce a complete evolutionaryclassification <strong>of</strong> eukaryotic genes. <strong>The</strong> original COGsconsisted, at a minimum, <strong>of</strong> proteins from three species,which enhanced the power <strong>of</strong> the analysis and allowed incorporation<strong>of</strong> even those orthologs that showed low sequencesimilarity to each other. In the present analysis,we also identified clusters <strong>of</strong> putative orthologs from twospecies (TWOGs) and lineage-specific expansions <strong>of</strong> paralogsfrom each <strong>of</strong> the analyzed genomes (Lespinet et al.2002; Tatusov et al. 2003). Thus, at least in principle,each gene in the seven analyzed eukaryotic genomes isaccounted for in the emerging evolutionary classification.Of the 112,920 analyzed proteins, 65,170 belonged toKOGs (including TWOGs), 23,436 belonged to LSEs,and 24,314 remain singletons (“orfans”). Both the considerablelevel <strong>of</strong> evolutionary conservation—given thewide phylogenetic span <strong>of</strong> the analyzed genomes, eachKOG should be considered a highly conserved family—and the major contribution <strong>of</strong> LSEs are notable. Furthermore,the number <strong>of</strong> orfans is likely to be inflated as some<strong>of</strong> these undoubtedly are gene prediction artifacts. Figure1 shows the assignment <strong>of</strong> the proteins from each <strong>of</strong> theanalyzed eukaryotes to KOGs with different numbers <strong>of</strong>species (including TWOGs) and LSEs. <strong>The</strong> fraction <strong>of</strong>proteins assigned to KOGs generally decreases with theincreasing genome size, from 81% for the fission yeast S.pombe to 51% for the largest, the human genome. <strong>The</strong>contribution <strong>of</strong> LSEs shows the opposite trend, being thegreatest in the largest genomes, i.e., human and Ara-# proteins14000120001000080006000400020000sce0 1 ecu2 3 4 5 6 7# species in KOGsFigure 1. Assignment <strong>of</strong> proteins from each <strong>of</strong> the seven analyzedeukaryotic genomes to KOGs <strong>of</strong> different size and toLSEs. “0” indicates proteins without detectable homologs (orfans)and “1” indicates LSEs. Species abbreviations: (ath) Arabidopsisthaliana, (cel) Caenorhabditis elegans, (dme)Drosophila melanogaster, (ecu) Encephalitozoon cuniculi,(has) <strong>Homo</strong> <strong>sapiens</strong>, (sce) Saccharomyces cerevisiae, (spo,)Schizosaccharomyces pombe.spoathhsadmecel


