

The Genom of Homo sapiens.pdf
The Genom of Homo sapiens.pdf
The Genom of Homo sapiens.pdf
- TAGS
- homo
- www.yumpu.com

Create successful ePaper yourself
Turn your PDF publications into a flip-book with our unique Google optimized e-Paper software.
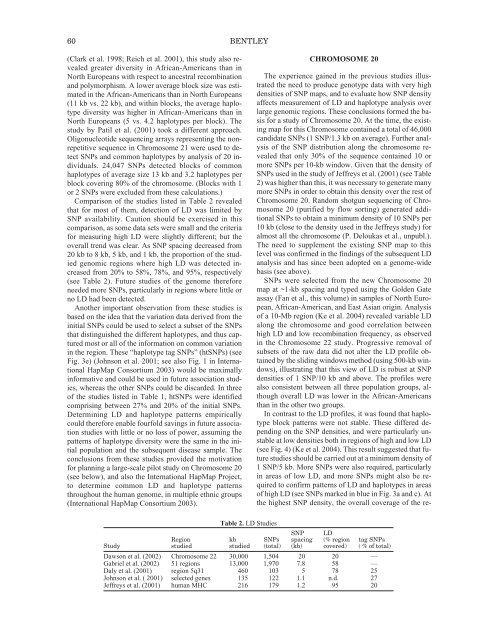
60 BENTLEY(Clark et al. 1998; Reich et al. 2001), this study also revealedgreater diversity in African-Americans than inNorth Europeans with respect to ancestral recombinationand polymorphism. A lower average block size was estimatedin the African-Americans than in North Europeans(11 kb vs. 22 kb), and within blocks, the average haplotypediversity was higher in African-Americans than inNorth Europeans (5 vs. 4.2 haplotypes per block). <strong>The</strong>study by Patil et al. (2001) took a different approach.Oligonucleotide sequencing arrays representing the nonrepetitivesequence in Chromosome 21 were used to detectSNPs and common haplotypes by analysis <strong>of</strong> 20 individuals.24,047 SNPs detected blocks <strong>of</strong> commonhaplotypes <strong>of</strong> average size 13 kb and 3.2 haplotypes perblock covering 80% <strong>of</strong> the chromosome. (Blocks with 1or 2 SNPs were excluded from these calculations.)Comparison <strong>of</strong> the studies listed in Table 2 revealedthat for most <strong>of</strong> them, detection <strong>of</strong> LD was limited bySNP availability. Caution should be exercised in thiscomparison, as some data sets were small and the criteriafor measuring high LD were slightly different; but theoverall trend was clear. As SNP spacing decreased from20 kb to 8 kb, 5 kb, and 1 kb, the proportion <strong>of</strong> the studiedgenomic regions where high LD was detected increasedfrom 20% to 58%, 78%, and 95%, respectively(see Table 2). Future studies <strong>of</strong> the genome thereforeneeded more SNPs, particularly in regions where little orno LD had been detected.Another important observation from these studies isbased on the idea that the variation data derived from theinitial SNPs could be used to select a subset <strong>of</strong> the SNPsthat distinguished the different haplotypes, and thus capturedmost or all <strong>of</strong> the information on common variationin the region. <strong>The</strong>se “haplotype tag SNPs” (htSNPs) (seeFig. 3e) (Johnson et al. 2001; see also Fig. 1 in InternationalHapMap Consortium 2003) would be maximallyinformative and could be used in future association studies,whereas the other SNPs could be discarded. In three<strong>of</strong> the studies listed in Table 1, htSNPs were identifiedcomprising between 27% and 20% <strong>of</strong> the initial SNPs.Determining LD and haplotype patterns empiricallycould therefore enable fourfold savings in future associationstudies with little or no loss <strong>of</strong> power, assuming thepatterns <strong>of</strong> haplotype diversity were the same in the initialpopulation and the subsequent disease sample. <strong>The</strong>conclusions from these studies provided the motivationfor planning a large-scale pilot study on Chromosome 20(see below), and also the International HapMap Project,to determine common LD and haplotype patternsthroughout the human genome, in multiple ethnic groups(International HapMap Consortium 2003).CHROMOSOME 20<strong>The</strong> experience gained in the previous studies illustratedthe need to produce genotype data with very highdensities <strong>of</strong> SNP maps, and to evaluate how SNP densityaffects measurement <strong>of</strong> LD and haplotype analysis overlarge genomic regions. <strong>The</strong>se conclusions formed the basisfor a study <strong>of</strong> Chromosome 20. At the time, the existingmap for this Chromosome contained a total <strong>of</strong> 46,000candidate SNPs (1 SNP/1.3 kb on average). Further analysis<strong>of</strong> the SNP distribution along the chromosome revealedthat only 30% <strong>of</strong> the sequence contained 10 ormore SNPs per 10-kb window. Given that the density <strong>of</strong>SNPs used in the study <strong>of</strong> Jeffreys et al. (2001) (see Table2) was higher than this, it was necessary to generate manymore SNPs in order to obtain this density over the rest <strong>of</strong>Chromosome 20. Random shotgun sequencing <strong>of</strong> Chromosome20 (purified by flow sorting) generated additionalSNPs to obtain a minimum density <strong>of</strong> 10 SNPs per10 kb (close to the density used in the Jeffreys study) foralmost all the chromosome (P. Deloukas et al., unpubl.).<strong>The</strong> need to supplement the existing SNP map to thislevel was confirmed in the findings <strong>of</strong> the subsequent LDanalysis and has since been adopted on a genome-widebasis (see above).SNPs were selected from the new Chromosome 20map at ~1-kb spacing and typed using the Golden Gateassay (Fan et al., this volume) in samples <strong>of</strong> North European,African-American, and East Asian origin. Analysis<strong>of</strong> a 10-Mb region (Ke et al. 2004) revealed variable LDalong the chromosome and good correlation betweenhigh LD and low recombination frequency, as observedin the Chromosome 22 study. Progressive removal <strong>of</strong>subsets <strong>of</strong> the raw data did not alter the LD pr<strong>of</strong>ile obtainedby the sliding windows method (using 500-kb windows),illustrating that this view <strong>of</strong> LD is robust at SNPdensities <strong>of</strong> 1 SNP/10 kb and above. <strong>The</strong> pr<strong>of</strong>iles werealso consistent between all three population groups, althoughoverall LD was lower in the African-Americansthan in the other two groups.In contrast to the LD pr<strong>of</strong>iles, it was found that haplotypeblock patterns were not stable. <strong>The</strong>se differed dependingon the SNP densities, and were particularly unstableat low densities both in regions <strong>of</strong> high and low LD(see Fig. 4) (Ke et al. 2004). This result suggested that futurestudies should be carried out at a minimum density <strong>of</strong>1 SNP/5 kb. More SNPs were also required, particularlyin areas <strong>of</strong> low LD, and more SNPs might also be requiredto confirm patterns <strong>of</strong> LD and haplotypes in areas<strong>of</strong> high LD (see SNPs marked in blue in Fig. 3a and c). Atthe highest SNP density, the overall coverage <strong>of</strong> the re-Table 2. LD StudiesSNP LDRegion kb SNPs spacing (% region tag SNPsStudy studied studied (total) (kb) covered) ( % <strong>of</strong> total)Dawson et al. (2002) Chromosome 22 30,000 1,504 20 20 —Gabriel et al. (2002) 51 regions 13,000 1,970 7.8 58 —Daly et al. (2001) region 5q31 460 103 5 78 25Johnson et al. ( 2001) selected genes 135 122 1.1 n.d. 27Jeffreys et al. (2001) human MHC 216 179 1.2 95 20


