- Page 6 and 7:
ForewordIn 2001, as we considered t
- Page 8:
The Finished Genome Sequence of Hom
- Page 11 and 12:
4 ROGERSFigure 2. Accumulation of h
- Page 13 and 14:
6 ROGERSFigure 4. Sequencing center
- Page 15 and 16:
8 ROGERSabcFigure 5. Ensembl view o
- Page 17 and 18:
10 ROGERS2000. Analysis of vertebra
- Page 20 and 21:
The Human Genome: Genes, Pseudogene
- Page 22 and 23:
VARIATION ON CHROMOSOME 7 15rived f
- Page 24 and 25:
VARIATION ON CHROMOSOME 7 17DNAs an
- Page 26 and 27:
VARIATION ON CHROMOSOME 7 19expecte
- Page 28 and 29:
VARIATION ON CHROMOSOME 7 21Drosoph
- Page 30 and 31:
Mutational Profiling in the Human G
- Page 32 and 33:
HUMAN MUTATIONAL PROFILING 25Anothe
- Page 34 and 35:
HUMAN MUTATIONAL PROFILING 27Figure
- Page 36:
HUMAN MUTATIONAL PROFILING 29Rieder
- Page 39 and 40:
32 SCHMUTZ ET AL.algorithm itself,
- Page 41 and 42:
34 SCHMUTZ ET AL.Figure 2. Genomic
- Page 43 and 44:
36 SCHMUTZ ET AL.compared. Some of
- Page 46 and 47:
Human Subtelomeric DNAH. RIETHMAN,
- Page 48 and 49:
HUMAN SUBTELOMERIC SEQUENCES 41The
- Page 50 and 51:
HUMAN SUBTELOMERIC SEQUENCES 43cate
- Page 52 and 53:
HUMAN SUBTELOMERIC SEQUENCES 45Figu
- Page 54:
HUMAN SUBTELOMERIC SEQUENCES 47pres
- Page 57 and 58:
50 COLLINSand expand the genomics r
- Page 59 and 60:
52 COLLINSFigure 2. A public-sector
- Page 61 and 62:
54 COLLINSdefine all the parts of t
- Page 63 and 64:
56 BENTLEYmon over many generations
- Page 65 and 66:
58 BENTLEYTable 1. Genetic Disease
- Page 67 and 68:
60 BENTLEY(Clark et al. 1998; Reich
- Page 69 and 70:
62 BENTLEYACKNOWLEDGMENTSThe author
- Page 72 and 73:
SNP Genotyping and Molecular Haplot
- Page 74:
GENETIC ANALYSIS OF DNA POOLS 67gen
- Page 77 and 78:
70 FAN ET AL.matrix is then mated t
- Page 79 and 80:
72 FAN ET AL.Figure 3. Views of gen
- Page 81 and 82:
74 FAN ET AL.including 32 duplicate
- Page 83 and 84:
76 FAN ET AL.Figure 7. Allele-speci
- Page 85 and 86:
78 FAN ET AL.microsphere-based assa
- Page 87 and 88:
80 BERTRANPETIT ET AL.function, may
- Page 89 and 90:
82 BERTRANPETIT ET AL.diversity in
- Page 91 and 92:
84 BERTRANPETIT ET AL.gree of block
- Page 93 and 94:
86 BERTRANPETIT ET AL.Figure 1. Dec
- Page 95 and 96:
88 BERTRANPETIT ET AL.1999. Populat
- Page 97 and 98:
90 WINDEMUTH ET AL.Expression data.
- Page 99 and 100:
92 WINDEMUTH ET AL.Table 1. A Summa
- Page 101 and 102:
94 WINDEMUTH ET AL.Table 2. Signifi
- Page 103 and 104:
96 WINDEMUTH ET AL.Table 3. Summary
- Page 105 and 106:
98 WINDEMUTH ET AL.Table 6. List of
- Page 107 and 108:
100 WINDEMUTH ET AL.Table 6. (Conti
- Page 109 and 110:
102 WINDEMUTH ET AL.Table 6. (Conti
- Page 111 and 112:
104 WINDEMUTH ET AL.much of a surpr
- Page 113 and 114:
106 WINDEMUTH ET AL.Given our resul
- Page 116 and 117:
Genetic Variation and the Control o
- Page 118 and 119:
GENETIC CONTROL OF TRANSCRIPTION 11
- Page 120 and 121:
GENETIC CONTROL OF TRANSCRIPTION 11
- Page 122 and 123:
Genome-wide Detection and Analysis
- Page 124 and 125:
RECENT SEGMENTAL DUPLICATIONS 117Fi
- Page 126 and 127:
RECENT SEGMENTAL DUPLICATIONS 119St
- Page 128 and 129:
RECENT SEGMENTAL DUPLICATIONS 121Co
- Page 130 and 131:
RECENT SEGMENTAL DUPLICATIONS 123Ho
- Page 132 and 133:
The Effects of Evolutionary Distanc
- Page 134 and 135:
EVOLUTIONARY DISTANCE AND GENE PRED
- Page 136 and 137:
EVOLUTIONARY DISTANCE AND GENE PRED
- Page 138 and 139:
Lineage-specific Expansion of KRAB
- Page 140 and 141:
EVOLUTION OF ZNF GENES 133Figure 2.
- Page 142 and 143:
EVOLUTION OF ZNF GENES 135Figure 4.
- Page 144 and 145:
EVOLUTION OF ZNF GENES 137get gene,
- Page 146 and 147:
EVOLUTION OF ZNF GENES 139Y., Goodw
- Page 148 and 149:
Sequence Organization and Functiona
- Page 150 and 151:
CENTROMERE ANNOTATION 143THE CENTRO
- Page 152 and 153:
CENTROMERE ANNOTATION 145Figure 4.
- Page 154 and 155:
CENTROMERE ANNOTATION 147CONCLUSION
- Page 156:
CENTROMERE ANNOTATION 149Schueler M
- Page 159 and 160:
152 PARKHILL AND THOMSONFigure 1. T
- Page 161 and 162:
154 PARKHILL AND THOMSONshow very h
- Page 163 and 164:
156 PARKHILL AND THOMSONGene Loss a
- Page 165 and 166:
158 PARKHILL AND THOMSONYersinia ad
- Page 167 and 168:
160 MCKAY ET AL.Choosing Candidate
- Page 169 and 170:
162 MCKAY ET AL.new comparative too
- Page 171 and 172:
164 MCKAY ET AL.rich. Based on a th
- Page 173 and 174:
166 MCKAY ET AL.Embryonic Muscle an
- Page 175 and 176:
168 MCKAY ET AL.native polyadenylat
- Page 178 and 179:
Building Comparative Maps Using 1.5
- Page 180 and 181:
HUMAN CHROMOSOME 1p IN THE DOG 1731
- Page 182 and 183:
HUMAN CHROMOSOME 1p IN THE DOG 175(
- Page 184:
HUMAN CHROMOSOME 1p IN THE DOG 177l
- Page 187 and 188:
180 GEORGES AND ANDERSSON5. There i
- Page 189 and 190:
182 GEORGES AND ANDERSSONplied to r
- Page 191 and 192:
184 GEORGES AND ANDERSSONbe common
- Page 193 and 194:
186 GEORGES AND ANDERSSONin humans
- Page 196 and 197:
Evolving Methods for the Assembly o
- Page 198 and 199:
ASSEMBLING LARGE GENOMES 191Figure
- Page 200 and 201:
ASSEMBLING LARGE GENOMES 193tant ad
- Page 202 and 203:
Mouse Genome Encyclopedia ProjectY.
- Page 204 and 205:
MOUSE GENOME ENCYCLOPEDIA PROJECT 1
- Page 206 and 207:
MOUSE GENOME ENCYCLOPEDIA PROJECT 1
- Page 208 and 209:
MOUSE GENOME ENCYCLOPEDIA PROJECT 2
- Page 210 and 211:
MOUSE GENOME ENCYCLOPEDIA PROJECT 2
- Page 212 and 213:
DNA Sequence Assembly and Multiple
- Page 214 and 215:
EULERIAN ASSEMBLY AND MULTIPLE ALIG
- Page 216 and 217:
EULERIAN ASSEMBLY AND MULTIPLE ALIG
- Page 218 and 219:
EULERIAN ASSEMBLY AND MULTIPLE ALIG
- Page 220 and 221:
Ensembl: A Genome InfrastructureE.
- Page 222:
ENSEMBL 215projects often submit th
- Page 225 and 226:
218 ZHANGthe majority of these are
- Page 227 and 228:
220 ZHANGFigure 2. Demonstration of
- Page 229 and 230:
222 ZHANG(G.X. Chen et al., in prep
- Page 231 and 232:
224 ZHANGWe are waiting for experim
- Page 234 and 235:
Ontologies for Biologists: A Commun
- Page 236 and 237:
ONTOLOGIES FOR BIOLOGISTS 229al. 20
- Page 238 and 239:
ONTOLOGIES FOR BIOLOGISTS 231TOPIC
- Page 240 and 241:
ONTOLOGIES FOR BIOLOGISTS 233a.b.Fi
- Page 242:
ONTOLOGIES FOR BIOLOGISTS 2352003.
- Page 245 and 246:
238 JOSHI-TOPE ET AL.Figure 1. The
- Page 247 and 248:
240 JOSHI-TOPE ET AL.state of knowl
- Page 249 and 250:
242 JOSHI-TOPE ET AL.and co-immunop
- Page 252 and 253:
The Share of Human Genomic DNA unde
- Page 254 and 255:
DNA UNDER SELECTION FROM HUMAN-MOUS
- Page 256 and 257:
DNA UNDER SELECTION FROM HUMAN-MOUS
- Page 258 and 259:
DNA UNDER SELECTION FROM HUMAN-MOUS
- Page 260 and 261:
DNA UNDER SELECTION FROM HUMAN-MOUS
- Page 262 and 263:
Detecting Highly Conserved Regions
- Page 264 and 265:
DETECTING MULTISPECIES CONSERVED SE
- Page 266 and 267:
DETECTING MULTISPECIES CONSERVED SE
- Page 268 and 269:
DETECTING MULTISPECIES CONSERVED SE
- Page 270:
DETECTING MULTISPECIES CONSERVED SE
- Page 273 and 274:
266 ROE ET AL.noncoding regions. On
- Page 275 and 276:
268 ROE ET AL.a48 hpf embryos in Mi
- Page 277 and 278:
270 ROE ET AL.aNovel gene KIAA0819[
- Page 279 and 280:
272 ROE ET AL.aMouseRatAP00354.2 Hu
- Page 281 and 282:
274 ROE ET AL.Tautz D. and Pfeifle
- Page 283 and 284:
276 JAILLON ET AL.Detection of Evol
- Page 285 and 286:
278 JAILLON ET AL.Table 1. Distribu
- Page 287 and 288:
280 JAILLON ET AL.Table 3. Distribu
- Page 289 and 290:
282 JAILLON ET AL.ecotig is a resul
- Page 291 and 292:
284 OVCHARENKO AND LOOTSdivergent r
- Page 293 and 294:
286 OVCHARENKO AND LOOTSmodulation
- Page 295 and 296: 288 OVCHARENKO AND LOOTSsequencing
- Page 297 and 298: 290 OVCHARENKO AND LOOTSments of cl
- Page 300 and 301: Evolution of Eukaryotic Gene Repert
- Page 302 and 303: EVOLUTION OF EUKARYOTIC GENES AND I
- Page 304 and 305: EVOLUTION OF EUKARYOTIC GENES AND I
- Page 306 and 307: EVOLUTION OF EUKARYOTIC GENES AND I
- Page 308: EVOLUTION OF EUKARYOTIC GENES AND I
- Page 311 and 312: 304 PENNACCHIO, BAROUKH, AND RUBINA
- Page 313 and 314: 306 PENNACCHIO, BAROUKH, AND RUBINh
- Page 315 and 316: 308 PENNACCHIO, BAROUKH, AND RUBINA
- Page 318: High-Throughput Mouse Knockouts Pro
- Page 321 and 322: 314 FRIDDLE ET AL.screen to lines o
- Page 324 and 325: Identification of Novel Functional
- Page 326 and 327: 100 bp ladder68G1168G1168H1168H6100
- Page 328 and 329: FUNCTIONAL ELEMENTS IN HUMAN DNA 32
- Page 330 and 331: High-resolution Human Genome Scanni
- Page 332 and 333: HUMAN GENOME SCANNING 325false-posi
- Page 334 and 335: HUMAN GENOME SCANNING 327affecting
- Page 336: HUMAN GENOME SCANNING 329methods fo
- Page 339 and 340: 332 MALEK ET AL.Figure 1. The bacte
- Page 341 and 342: 334 MALEK ET AL.J., Vincent S., and
- Page 343 and 344: 336 HARDISON ET AL.reflect blocks o
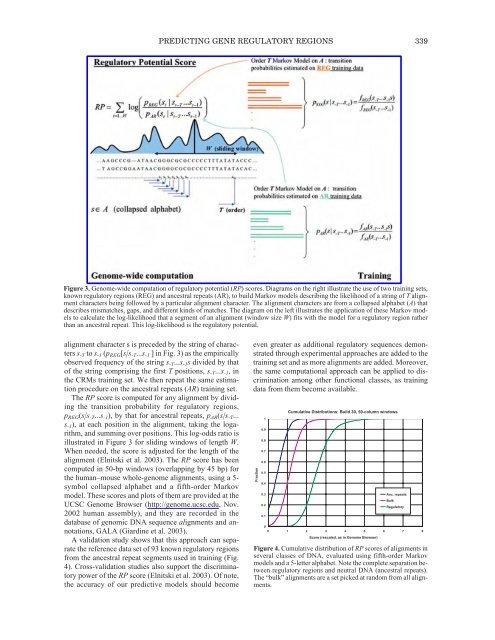
- Page 345: 338 HARDISON ET AL.plain the region
- Page 349 and 350: 342 HARDISON ET AL.PositionRP2.3noE
- Page 351 and 352: 344 HARDISON ET AL.cific chromosoma
- Page 353 and 354: 346 WESTON ET AL.these differences
- Page 355 and 356: 348 WESTON ET AL.els controlled by
- Page 357 and 358: 350 WESTON ET AL.ures prominently i
- Page 359 and 360: 352 WESTON ET AL.nal and Bop, which
- Page 361 and 362: 354 WESTON ET AL.ablp 1466 bopbcrtB
- Page 363 and 364: 356 WESTON ET AL.like fold (Fig. 6)
- Page 366 and 367: Implications of Genomics for Public
- Page 368 and 369: GENETIC EPIDEMIOLOGY 361lytic epide
- Page 370 and 371: GENETIC EPIDEMIOLOGY 363curate risk
- Page 372 and 373: A Model System for Identifying Gene
- Page 374 and 375: PTC TASTE GENETICS 367Figure 2. Hap
- Page 376 and 377: PTC TASTE GENETICS 369Table 2. Hapl
- Page 378: PTC TASTE GENETICS 371the emergence
- Page 381 and 382: 374 MCCALLION ET AL.Figure 1. Schem
- Page 383 and 384: 376 MCCALLION ET AL.lier (Carrasqui
- Page 385 and 386: 378 MCCALLION ET AL.Table 3. HSCR A
- Page 387 and 388: 380 MCCALLION ET AL.Figure 3. Trans
- Page 390 and 391: Genetics of Schizophrenia and Bipol
- Page 392 and 393: SCHIZOPHRENIA AND BIPOLAR AFFECTIVE
- Page 394 and 395: SCHIZOPHRENIA AND BIPOLAR AFFECTIVE
- Page 396 and 397:
SCHIZOPHRENIA AND BIPOLAR AFFECTIVE
- Page 398 and 399:
SCHIZOPHRENIA AND BIPOLAR AFFECTIVE
- Page 400 and 401:
SCHIZOPHRENIA AND BIPOLAR AFFECTIVE
- Page 402 and 403:
The Genetics of Common Diseases: 10
- Page 404 and 405:
GENETICS OF COMMON DISEASES 397with
- Page 406 and 407:
GENETICS OF COMMON DISEASES 399SELE
- Page 408:
GENETICS OF COMMON DISEASES 401F.,
- Page 411 and 412:
404 CHEUNG ET AL.netic analysis. Ex
- Page 413 and 414:
406 CHEUNG ET AL.Figure 3. The expr
- Page 416 and 417:
Regulation of α-Synuclein Expressi
- Page 418 and 419:
α-SYNUCLEIN EXPRESSION AND PD 411T
- Page 420 and 421:
1. The levels of α-synuclein prote
- Page 422:
α-SYNUCLEIN EXPRESSION AND PD 415g
- Page 425 and 426:
418 BOTSTEINFigure 1. (A) Blectron
- Page 427 and 428:
420 BOTSTEINFigure 3. Cluster diagr
- Page 429 and 430:
422 BOTSTEINFigure 6. Kaplan-Meier
- Page 431 and 432:
424 BOTSTEINGarber M.E., Troyanskay
- Page 433 and 434:
426 ANTONARAKIS ET AL.1316192225283
- Page 435 and 436:
428 ANTONARAKIS ET AL.Figure 5. Sam
- Page 437 and 438:
430 ANTONARAKIS ET AL.POPULATION VA
- Page 439 and 440:
432 JORGENSEN ET AL.tive small mole
- Page 441 and 442:
434 JORGENSEN ET AL.FLAG-tagged pro
- Page 443 and 444:
436 JORGENSEN ET AL.visualization t
- Page 445 and 446:
438 JORGENSEN ET AL.AArp2/3 Complex
- Page 447 and 448:
Pathway40S440 JORGENSEN ET AL.ANutr
- Page 449 and 450:
442 JORGENSEN ET AL.Giaever G., Chu
- Page 452 and 453:
Genomic Disorders: Genome Architect
- Page 454 and 455:
GENOME ARCHITECTURE AND GENOMIC DIS
- Page 456 and 457:
GENOME ARCHITECTURE AND GENOMIC DIS
- Page 458 and 459:
GENOME ARCHITECTURE AND GENOMIC DIS
- Page 460 and 461:
GENOME ARCHITECTURE AND GENOMIC DIS
- Page 462 and 463:
Human Versus Chimpanzee Chromosome-
- Page 464 and 465:
HUMAN VS. CHIMP CHROMOSOME COMPARIS
- Page 466 and 467:
HUMAN VS. CHIMP CHROMOSOME COMPARIS
- Page 468 and 469:
Novel Transcriptional Units and Unc
- Page 470 and 471:
TRANSCRIPTIONAL UNITS AND GENE PAIR
- Page 472 and 473:
TRANSCRIPTIONAL UNITS AND GENE PAIR
- Page 474 and 475:
TRANSCRIPTIONAL UNITS AND GENE PAIR
- Page 476 and 477:
TRANSCRIPTIONAL UNITS AND GENE PAIR
- Page 478 and 479:
mtDNA Variation, Climatic Adaptatio
- Page 480 and 481:
mtDNA VARIATION 473Figure 3. Region
- Page 482 and 483:
ANALYSIS OF ADAPTIVE SELECTION FORR
- Page 484 and 485:
mtDNA VARIATION 477Figure 8. Temper
- Page 486 and 487:
Positive Selection in the Human Gen
- Page 488 and 489:
HUMAN-SPECIFIC EVOLUTIONARY CHANGES
- Page 490 and 491:
HUMAN-SPECIFIC EVOLUTIONARY CHANGES
- Page 492:
HUMAN-SPECIFIC EVOLUTIONARY CHANGES
- Page 495 and 496:
488 UNDERHILLorigin episodes, each
- Page 497 and 498:
490 UNDERHILLhaplogroups C through
- Page 499 and 500:
492 UNDERHILLO (Fig. 2e) that share
- Page 502 and 503:
The New Quantitative BiologyM.V. OL
- Page 504 and 505:
NEW QUANTITATIVE BIOLOGY 497alone.
- Page 506 and 507:
NEW QUANTITATIVE BIOLOGY 499There w
- Page 508 and 509:
NEW QUANTITATIVE BIOLOGY 501ceded,