World Disasters Report 2010 - International Federation of Red Cross ...
World Disasters Report 2010 - International Federation of Red Cross ...
World Disasters Report 2010 - International Federation of Red Cross ...

Create successful ePaper yourself
Turn your PDF publications into a flip-book with our unique Google optimized e-Paper software.
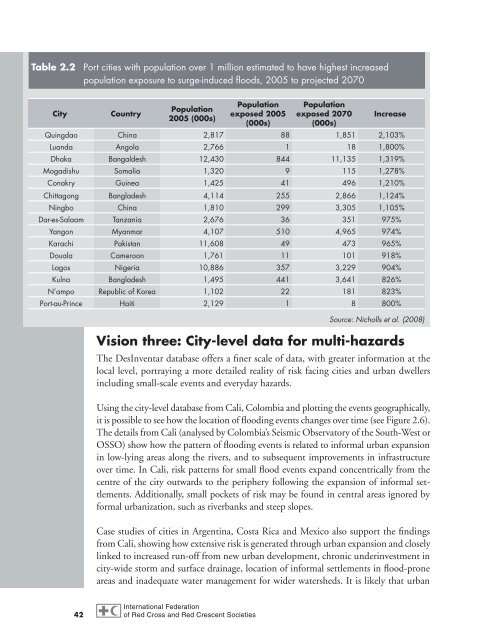
Table 2.2 Port cities with population over 1 million estimated to have highest increased<br />
population exposure to surge-induced floods, 2005 to projected 2070<br />
City Country<br />
42<br />
Population<br />
2005 (000s)<br />
Population<br />
exposed 2005<br />
(000s)<br />
Population<br />
exposed 2070<br />
(000s)<br />
Increase<br />
Quingdao China 2,817 88 1,851 2,103%<br />
Luanda Angola 2,766 1 18 1,800%<br />
Dhaka Bangaldesh 12,430 844 11,135 1,319%<br />
Mogadishu Somalia 1,320 9 115 1,278%<br />
Conakry Guinea 1,425 41 496 1,210%<br />
Chittagong Bangladesh 4,114 255 2,866 1,124%<br />
Ningbo China 1,810 299 3,305 1,105%<br />
Dar-es-Salaam Tanzania 2,676 36 351 975%<br />
Yangon Myanmar 4,107 510 4,965 974%<br />
Karachi Pakistan 11,608 49 473 965%<br />
Douala Cameroon 1,761 11 101 918%<br />
Lagos Nigeria 10,886 357 3,229 904%<br />
Kulna Bangladesh 1,495 441 3,641 826%<br />
N’ampo Republic <strong>of</strong> Korea 1,102 22 181 823%<br />
Port-au-Prince Haiti 2,129 1 8 800%<br />
Source: Nicholls et al. (2008)<br />
Vision three: City-level data for multi-hazards<br />
The DesInventar database <strong>of</strong>fers a finer scale <strong>of</strong> data, with greater information at the<br />
local level, portraying a more detailed reality <strong>of</strong> risk facing cities and urban dwellers<br />
including small-scale events and everyday hazards.<br />
Using the city-level database from Cali, Colombia and plotting the events geographically,<br />
it is possible to see how the location <strong>of</strong> flooding events changes over time (see Figure 2.6).<br />
The details from Cali (analysed by Colombia’s Seismic Observatory <strong>of</strong> the South-West or<br />
OSSO) show how the pattern <strong>of</strong> flooding events is related to informal urban expansion<br />
in low-lying areas along the rivers, and to subsequent improvements in infrastructure<br />
over time. In Cali, risk patterns for small flood events expand concentrically from the<br />
centre <strong>of</strong> the city outwards to the periphery following the expansion <strong>of</strong> informal settlements.<br />
Additionally, small pockets <strong>of</strong> risk may be found in central areas ignored by<br />
formal urbanization, such as riverbanks and steep slopes.<br />
Case studies <strong>of</strong> cities in Argentina, Costa Rica and Mexico also support the findings<br />
from Cali, showing how extensive risk is generated through urban expansion and closely<br />
linked to increased run-<strong>of</strong>f from new urban development, chronic underinvestment in<br />
city-wide storm and surface drainage, location <strong>of</strong> informal settlements in flood-prone<br />
areas and inadequate water management for wider watersheds. It is likely that urban