th - 1987 - 51st ENC Conference
th - 1987 - 51st ENC Conference
th - 1987 - 51st ENC Conference
You also want an ePaper? Increase the reach of your titles
YUMPU automatically turns print PDFs into web optimized ePapers that Google loves.
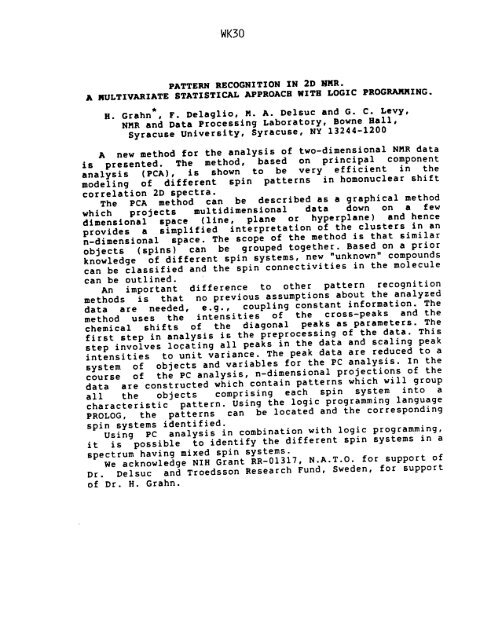
WK30<br />
PATTERN RECOGNITION IN 2D NMR.<br />
A MULTIVARIATE STATISTICAL APPROACH WITH LOGIC PROGRAMMING.<br />
H. Grahn , F. Delaglio, M. A. Delsuc and G. C. Levy,<br />
NMR and Data Processing Laboratory, Bowne Hall,<br />
Syracuse University, Syracuse, NY 13244-1200<br />
A new me<strong>th</strong>od for <strong>th</strong>e analysis of two-dimensional NMR data<br />
is presented. The me<strong>th</strong>od, based on principal component<br />
analysis (PCA), is shown to be very efficient in <strong>th</strong>e<br />
modeling of different spin patterns in homonuclear shift<br />
correlation 2D spectra.<br />
The PCA me<strong>th</strong>od can be described as a graphical me<strong>th</strong>od<br />
which projects multidimensional data down on a few<br />
dimensional space (line, plane or hyperplane) and hence<br />
provides a simplified interpretation of <strong>th</strong>e clusters in an<br />
n-dimensional space. The scope of <strong>th</strong>e me<strong>th</strong>od is <strong>th</strong>at similar<br />
objects (spins) can be grouped toge<strong>th</strong>er. Based on a prior<br />
knowledge of different spin systems, new "unknown" compounds<br />
can be classified and <strong>th</strong>e spin connectivities in <strong>th</strong>e molecule<br />
can be outlined.<br />
An important difference to o<strong>th</strong>er pattern recognition<br />
me<strong>th</strong>ods is <strong>th</strong>at no previous assumptions about <strong>th</strong>e analyzed<br />
data are needed, e.g., coupling constant information. The<br />
me<strong>th</strong>od uses <strong>th</strong>e intensities of <strong>th</strong>e cross-peaks and <strong>th</strong>e<br />
chemical shifts of <strong>th</strong>e diagonal peaks as parameters. The<br />
first step in analysis is <strong>th</strong>e preprocessing of <strong>th</strong>e data. This<br />
step involves locating all peaks in <strong>th</strong>e data and scaling peak<br />
intensities to unit variance. The peak data are reduced to a<br />
system of objects and variables for <strong>th</strong>e PC analysis. In <strong>th</strong>e<br />
course of <strong>th</strong>e PC analysis, n-dimensional projections of <strong>th</strong>e<br />
data are constructed which contain patterns which will group<br />
all <strong>th</strong>e objects comprising each spin system into a<br />
characteristic pattern. Using <strong>th</strong>e logic programming language<br />
PROLOG, <strong>th</strong>e patterns can be located and <strong>th</strong>e corresponding<br />
spin systems identified.<br />
Using PC analysis in combination wi<strong>th</strong> logic programming,<br />
it is possible to identify <strong>th</strong>e different spin systems in a<br />
spectrum having mixed spin systems.<br />
We acknowledge NIH Grant RR-01317, N.A.T.O. for support of<br />
Dr. Delsuc and Troedsson Research Fund, Sweden, for support<br />
of Dr. H. Grahn.


