
You also want an ePaper? Increase the reach of your titles
YUMPU automatically turns print PDFs into web optimized ePapers that Google loves.
Significant events<br />
Financials in brief<br />
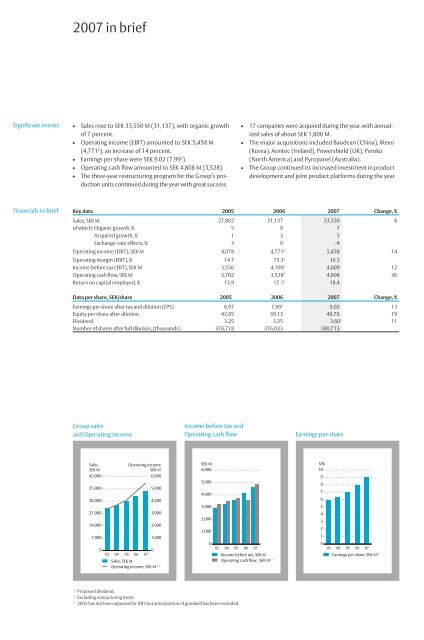
2007 in brief<br />
• Sales rose to SEK 33,550 M (31,137), with organic growth<br />
of 7 percent.<br />
• Operating income (EBIT) amounted to SEK 5,458 M<br />
(4,771 2 ), an increase of 14 percent.<br />
• Earnings per share were SEK 9.02 (7.99 2 ).<br />
• Operating cash flow amounted to SEK 4,808 M (3,528).<br />
• The three-year restructuring program for the Group’s production<br />
units continued during the year with great success.<br />
Group sales<br />
and Operating income<br />
Sales<br />
SEK M<br />
42,000<br />
35,000<br />
28,000<br />
21,000<br />
14,000<br />
7,000<br />
0<br />
03<br />
04<br />
05<br />
1 Proposed dividend.<br />
2 Excluding restructuring items.<br />
3 2003 has not been adjusted for IFRS but amortization of goodwill has been excluded.<br />
• 17 companies were acquired during the year, with annualized<br />
sales of about SEK 1,800 M.<br />
• The major acquisitions included Baodean (China), iRevo<br />
(Korea), Aontec (Ireland), Powershield (UK), Pemko<br />
(North America) and Pyropanel (Australia).<br />
• The Group continued its increased investment in product<br />
development and joint product platforms during the year.<br />
Key data 2005 2006 2007 Change, %<br />
Sales, SEK M 27,802 31,137 33,550 8<br />
of which: Organic growth, % 5 9 7<br />
Varav: Acquired growth, % 1 3 X 5<br />
Varav: Exchange-rate effects, % 3 0 –4<br />
Operating income (EBIT), SEK M 4,078 4,771 2 5,458 14<br />
Operating margin (EBIT), % 14.7 15.3 2 16.3<br />
Income before tax (EBT), SEK M 3,556 4,100 2 4,609 12<br />
Operating cash flow, SEK M 3,702 3,528 2 4,808 36<br />
Return on capital employed, % 15.9 17.1 2 18.4<br />
Data per share, SEK/share 2005 2006 2007 Change, %<br />
Earnings per share after tax and dilution (EPS) 6.97 7.99 2 9.02 13<br />
Equity per share after dilution 42.85 39.13 46.76 19<br />
Dividend 3.25 3.25 3.60 1 11<br />
Number of shares after full dilution, (thousands) 378,718 376,033 380,713<br />
Income before tax and<br />
Operating cash flow Earnings per share<br />
Operating income<br />
SEK M<br />
SEK M<br />
6,000<br />
6,000SEK<br />
M<br />
35,000<br />
5,000<br />
SEK M<br />
5,000<br />
06<br />
0<br />
07<br />
5,000<br />
4,000<br />
3,000<br />
2,000<br />
1,000<br />
Sales, SEK M<br />
2, 3<br />
Operating income, SEK M<br />
28,000<br />
4,000<br />
21,000 3,000<br />
14,000 2,000<br />
1,000<br />
7,000<br />
4,000<br />
3,000<br />
2,000<br />
1,000<br />
0<br />
03 04 05 06 07<br />
0<br />
98 99 Income 00 01 before 02 tax, 03SEK<br />
04M05<br />
06<br />
0<br />
07<br />
2 , 3<br />
Sales Operating cash flow<br />
Operating<br />
, SEK M<br />
income, SEK M<br />
2, 3<br />
SEK M<br />
5,00010<br />
9<br />
4,000 8<br />
7<br />
3,000 6<br />
5<br />
2,000 4<br />
3<br />
1,000 2<br />
1<br />
0 0<br />
98 0399<br />
04 00 01 05 0206<br />
030704<br />
05 06 07<br />
2, 3<br />
Income Earnings before per share, tax, SEK SEK M M<br />
2 , 3<br />
Operating cash flow, SEK M