
Create successful ePaper yourself
Turn your PDF publications into a flip-book with our unique Google optimized e-Paper software.
The ASSA ABLOY share<br />
94<br />
ASSA ABLOY’s 10 largest shareholders<br />
Based on the share register at 31 December 2007.<br />
Shareholders A shares B shares Share capital, % Votes, %<br />
Investment AB Latour 6,746,425 19,450,000 7.2 16.1<br />
SäkI 7,118,818 2,300,000 2.6 13.6<br />
Melker Schörling AB 5,310,080 9,162,136 4.0 11.6<br />
Alecta 26,686,000 7.3 5.0<br />
Swedbank Robur funds 14,796,038 4.0 2.7<br />
Oppenheimer funds 12,940,156 3.5 2.4<br />
Fidelity funds 12,340,442 3.4 2.3<br />
Harbor Funds Inc 12,033,608 3.3 2.2<br />
SEB funds 8,730,086 2.4 1.6<br />
Wärtsilä Corporation 7,270,350 2.0 1.4<br />
Other shareholders 221,033,895 60.4 41.0<br />
Total number 19,175,323 346,742,711 100.0 100.0<br />
Source: SIS Ägarservice AB and VPC AB.<br />
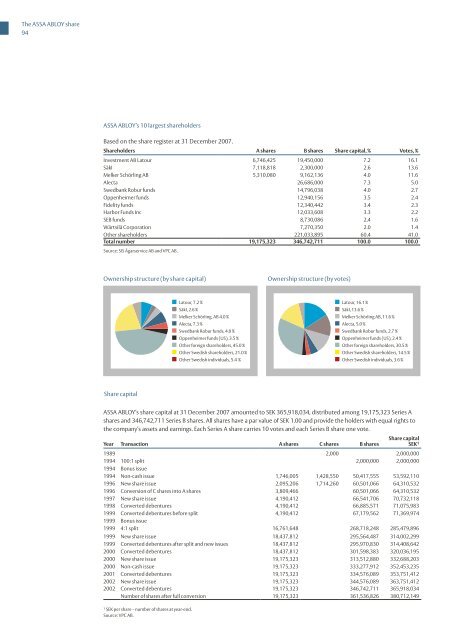
Ownership structure (by share capital) Ownership structure (by votes)<br />
Share capital<br />
ASSA ABLOY’s share capital at 31 December 2007 amounted to SEK 365,918,034, distributed among 19,175,323 Series A<br />
shares and 346,742,711 Series B shares. All shares have a par value of SEK 1.00 and provide the holders with equal rights to<br />
the company’s assets and earnings. Each Series A share carries 10 votes and each Series B share one vote.<br />
Share capital<br />
Year Transaction A shares C shares B shares<br />
SEK1 1989 2,000 2,000,000<br />
1994 100:1 split 2,000,000 2,000,000<br />
1994 Bonus issue<br />
1994 Non-cash issue 1,746,005 1,428,550 50,417,555 53,592,110<br />
1996 New share issue 2,095,206 1,714,260 60,501,066 64,310,532<br />
1996 Conversion of C shares into A shares 3,809,466 60,501,066 64,310,532<br />
1997 New share issue 4,190,412 66,541,706 70,732,118<br />
1998 Converted debentures 4,190,412 66,885,571 71,075,983<br />
1999 Converted debentures before split 4,190,412 67,179,562 71,369,974<br />
1999 Bonus issue<br />
1999 4:1 split 16,761,648 268,718,248 285,479,896<br />
1999 New share issue 18,437,812 295,564,487 314,002,299<br />
1999 Converted debentures after split and new issues 18,437,812 295,970,830 314,408,642<br />
2000 Converted debentures 18,437,812 301,598,383 320,036,195<br />
2000 New share issue 19,175,323 313,512,880 332,688,203<br />
2000 Non-cash issue 19,175,323 333,277,912 352,453,235<br />
2001 Converted debentures 19,175,323 334,576,089 353,751,412<br />
2002 New share issue 19,175,323 344,576,089 363,751,412<br />
2002 Converted debentures 19,175,323 346,742,711 365,918,034<br />
Number of shares after full conversion 19,175,323 361,536,826 380,712,149<br />
1 SEK per share – number of shares at year-end.<br />
Source: VPC AB.<br />
Latour, 7.2 %<br />
SäkI, 2.6 %<br />
Melker Schörling, AB 4.0 %<br />
Alecta, 7.3 %<br />
Swedbank Robur funds, 4.0 %<br />
Oppenheimer funds (US), 3.5 %<br />
Other foreign shareholders, 45.0 %<br />
Other Swedish shareholders, 21.0 %<br />
Other Swedish individuals, 5.4 %<br />
Latour, 16.1 %<br />
SäkI, 13.6 %<br />
Melker Schörling AB, 11.6 %<br />
Alecta, 5.0 %<br />
Swedbank Robur funds, 2.7 %<br />
Oppenheimer funds (US), 2.4 %<br />
Other foreign shareholders, 30.5 %<br />
Other Swedish shareholders, 14.5 %<br />
Other Swedish individuals, 3.6 %