
Create successful ePaper yourself
Turn your PDF publications into a flip-book with our unique Google optimized e-Paper software.
ASSA ABLOY<br />
Annual Report 2007<br />
72<br />
Notes 2–8<br />
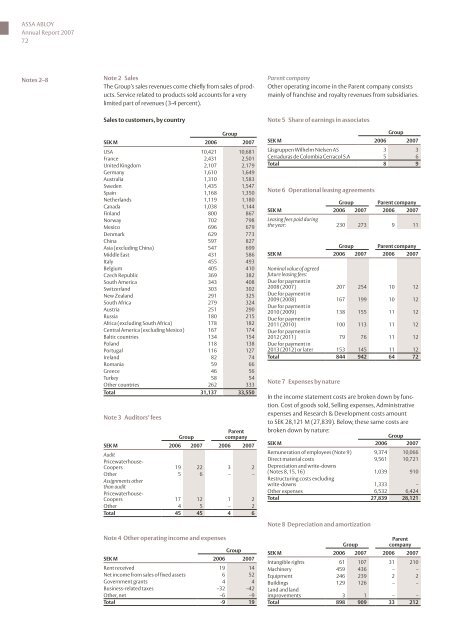
Note 2 Sales<br />
The Group’s sales revenues come chiefly from sales of products.<br />
Service related to products sold accounts for a very<br />
limited part of revenues (3-4 percent).<br />
Sales to customers, by country<br />
Group<br />
SEK M 2006 2007<br />
USA 10,421 10,681<br />
France 2,431 2,501<br />
United Kingdom 2,107 2,179<br />
Germany 1,610 1,649<br />
Australia 1,310 1,583<br />
Sweden 1,435 1,547<br />
Spain 1,168 1,350<br />
Netherlands 1,119 1,180<br />
Canada 1,038 1,144<br />
Finland 800 867<br />
Norway 702 798<br />
Mexico 696 679<br />
Denmark 629 773<br />
China 597 827<br />
Asia (excluding China) 547 699<br />
Middle East 431 586<br />
Italy 455 493<br />
Belgium 405 410<br />
Czech Republic 369 382<br />
South America 343 408<br />
Switzerland 303 302<br />
New Zealand 291 325<br />
South Africa 279 324<br />
Austria 251 290<br />
Russia 180 215<br />
Africa (excluding South Africa) 178 182<br />
Central America (excluding Mexico) 167 174<br />
Baltic countries 134 154<br />
Poland 118 138<br />
Portugal 116 127<br />
Ireland 82 74<br />
Romania 59 66<br />
Greece 46 56<br />
Turkey 58 54<br />
Other countries 262 333<br />
Total 31,137 33,550<br />
Note 3 Auditors’ fees<br />
Group<br />
Parent<br />
company<br />
SEK M 2006 2007 2006 2007<br />
Audit<br />
Pricewaterhouse-<br />
Coopers 19 22 3 2<br />
Other 5 6 – –<br />
Assignments other<br />
than audit<br />
Pricewaterhouse-<br />
Coopers 17 12 1 2<br />
Other 4 5 – 2<br />
Total 45 45 4 6<br />
Note 4 Other operating income and expenses<br />
Group<br />
SEK M 2006 2007<br />
Rent received 19 14<br />
Net income from sales of fixed assets 6 52<br />
Government grants 4 4<br />
Business-related taxes –32 –42<br />
Other, net –6 –9<br />
Total -9 19<br />
Parent company<br />
Other operating income in the Parent company consists<br />
mainly of franchise and royalty revenues from subsidiaries.<br />
Note 5 Share of earnings in associates<br />
Group<br />
SEK M 2006 2007<br />
Låsgruppen Wilhelm Nielsen AS 3 3<br />
Cerraduras de Colombia Cerracol S.A 5 6<br />
Total 8 9<br />
Note 6 Operational leasing agreements<br />
Group Parent company<br />
SEK M 2006 2007 2006 2007<br />
Leasing fees paid during<br />
the year: 230 273 9 11<br />
Group Parent company<br />
SEK M 2006 2007 2006 2007<br />
Nominal value of agreed<br />
future leasing fees:<br />
Due for payment in<br />
2008 (2007) 207 254 10 12<br />
Due for payment in<br />
2009 (2008) 167 199 10 12<br />
Due for payment in<br />
2010 (2009) 138 155 11 12<br />
Due for payment in<br />
2011 (2010) 100 113 11 12<br />
Due for payment in<br />
2012 (2011) 79 76 11 12<br />
Due for payment in<br />
2013 (2012) or later 153 145 11 12<br />
Total 844 942 64 72<br />
Note 7 Expenses by nature<br />
In the income statement costs are broken down by function.<br />
Cost of goods sold, Selling expenses, Administrative<br />
expenses and Research & Development costs amount<br />
to SEK 28,121 M (27,839). Below, these same costs are<br />
broken down by nature:<br />
Group<br />
SEK M 2006 2007<br />
Remuneration of employees (Note 9) 9,374 10,066<br />
Direct material costs 9,561 10,721<br />
Depreciation and write-downs<br />
(Notes 8, 15, 16) 1,039 910<br />
Restructuring costs excluding<br />
write-downs 1,333 –<br />
Other expenses 6,532 6,424<br />
Total 27,839 28,121<br />
Note 8 Depreciation and amortization<br />
Group<br />
Parent<br />
company<br />
SEK M 2006 2007 2006 2007<br />
Intangible rights 61 107 31 210<br />
Machinery 459 436 – –<br />
Equipment 246 239 2 2<br />
Buildings 129 126 – –<br />
Land and land<br />
improvements 3 1 – –<br />
Total 898 909 33 212