
Create successful ePaper yourself
Turn your PDF publications into a flip-book with our unique Google optimized e-Paper software.
ASSA ABLOY<br />
Annual Report 2007<br />
86<br />
Note 37<br />
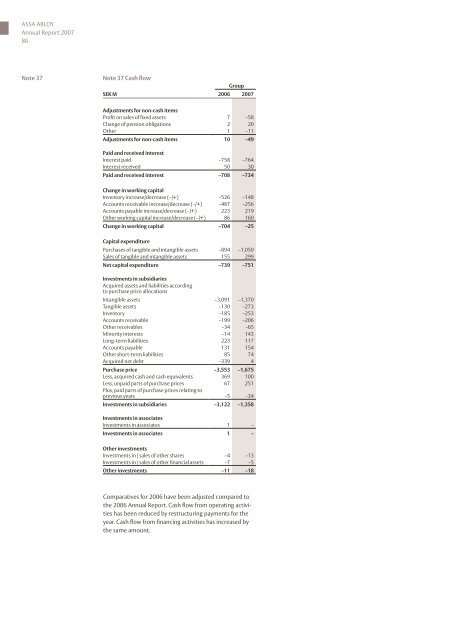
Note 37 Cash flow<br />
Group<br />
SEK M 2006 2007<br />
Adjustments for non-cash items<br />
Profit on sales of fixed assets 7 –58<br />
Change of pension obligations 2 20<br />
Other 1 –11<br />
Adjustments for non-cash items 10 –49<br />
Paid and received interest<br />
Interest paid –758 –764<br />
Interest received 50 30<br />
Paid and received interest –708 –734<br />
Change in working capital<br />
Inventory increase/decrease (–/+) –526 –148<br />
Accounts receivable increase/decrease (–/+) –487 –256<br />
Accounts payable increase/decrease (–/+) 223 219<br />
Other working capital increase/decrease (–/+) 86 160<br />
Change in working capital –704 –25<br />
Capital expenditure<br />
Purchases of tangible and intangible assets –894 –1,050<br />
Sales of tangible and intangible assets 155 299<br />
Net capital expenditure –739 –751<br />
Investments in subsidiaries<br />
Acquired assets and liabilities according<br />
to purchase price allocations<br />
Intangible assets –3,091 –1,370<br />
Tangible assets –130 –273<br />
Inventory –185 –253<br />
Accounts receivable –199 –206<br />
Other receivables –34 –65<br />
Minority interests –14 143<br />
Long-term liabilities 223 117<br />
Accounts payable 131 154<br />
Other short-term liabilities 85 74<br />
Acquired net debt –339 4<br />
Purchase price –3,553 –1,675<br />
Less, acquired cash and cash equivalents 369 100<br />
Less, unpaid parts of purchase prices<br />
Plus, paid parts of purchase prices relating to<br />
67 251<br />
previous years –5 –34<br />
Investments in subsidiaries –3,122 –1,358<br />
Investments in associates<br />
Investments in associates 1 –<br />
Investments in associates 1 –<br />
Other investments<br />
Investments in / sales of other shares –4 –13<br />
Investments in / sales of other financial assets –7 –5<br />
Other investments –11 –18<br />
Comparatives for 2006 have been adjusted compared to<br />
the 2006 Annual Report. Cash flow from operating activities<br />
has been reduced by restructuring payments for the<br />
year. Cash flow from financing activities has increased by<br />
the same amount.